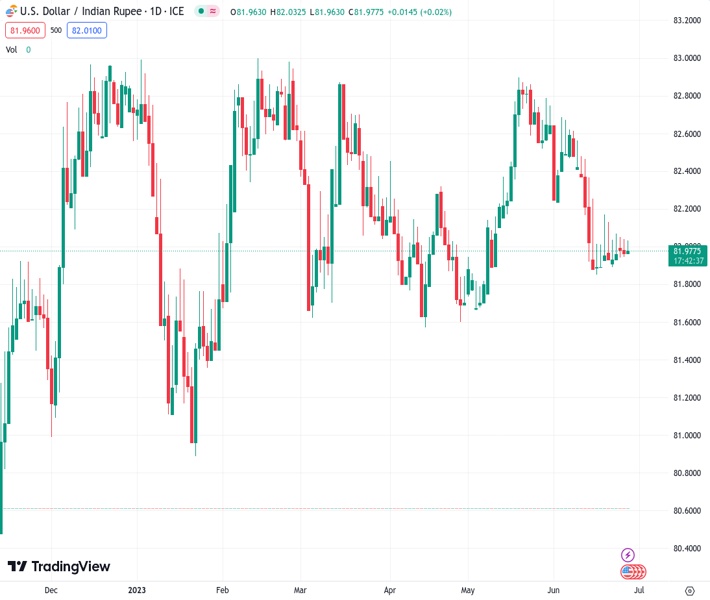
The USDINR currency pair is currently hovering around 81.9700 and is experiencing a decrease in selling prices, reaching a new low for the day. This is consistent with the candlestick formation known as a Doji, which was observed the day before. Analysts, like the user @nehcap, believe that there is unlikely to be a significant decline in the future.
…
This is a premium post.
[s2If !current_user_can(access_s2member_level4)]Please register for FREE REGISTER to read full post below containing analysis. In case of any error or you think you are not able to read the full post below, please email us at support#nehcap.com [lwa][/s2If] [s2If current_user_can(access_s2member_level1)]
- USD/INR takes offers to refresh intraday low, justifies the previous day’s Doji candlestick.
The pair currently trades last at 81.9700.
The previous day high was 82.1005 while the previous day low was 81.9393. The daily 38.2% Fib levels comes at 82.0009, expected to provide resistance. Similarly, the daily 61.8% fib level is at 82.0389, expected to provide resistance.
USD/INR slips off buyer’s radar after a three-day attempt to stay firmer around 82.00, refreshing intraday low near 81.95 during very early Wednesday morning in Europe.
In doing so, the Indian Rupee (INR) pair justifies the previous day’s Bearish Doji candlestick, as well as multiple failures to cross the 200-DMA hurdle.
However, an upward-sloping support line from mid-April joins the receding bearish bias of the MACD signals and the below-50.0 levels of the RSI (14) line to challenge the USD/INR bears around 81.90.
Even if the Indian Rupee (INR) buyers manage to conquer the 81.90 support, the monthly low of around 81.85 can act as the additional downside filter before confirming the seller’s dominance.
Following that, the double bottom around 81.50 will be in the spotlight.
On the contrary, the 200-DMA guards the immediate recovery moves of the USD/INR pair around 82.15 before pushing the bulls toward confronting the 82.20 resistance confluence comprising the 50-DMA and a one-month-old falling trend line.
That said, the early month swing low of near 82.30 can act as the last defense of the USD/INR bears prior to giving control to the bulls.
Trend: Limited downside expected
Technical Levels: Supports and Resistances
USDINR currently trading at 81.9763 at the time of writing. Pair opened at 81.9937 and is trading with a change of -0.02% % .
| Overview | Overview.1 | |
|---|---|---|
| 0 | Today last price | 81.9763 |
| 1 | Today Daily Change | -0.0174 |
| 2 | Today Daily Change % | -0.02% |
| 3 | Today daily open | 81.9937 |
The pair remains strongly bearish on the daily time frame. It trades below the 20 SMA @ 82.2132, 50 SMA 82.2085, 100 SMA @ 82.2701 and 200 SMA @ 82.1323.
| Trends | Trends.1 | |
|---|---|---|
| 0 | Daily SMA20 | 82.2132 |
| 1 | Daily SMA50 | 82.2085 |
| 2 | Daily SMA100 | 82.2701 |
| 3 | Daily SMA200 | 82.1323 |
The previous day high was 82.1005 while the previous day low was 81.9393. The daily 38.2% Fib levels comes at 82.0009, expected to provide resistance. Similarly, the daily 61.8% fib level is at 82.0389, expected to provide resistance.
Note the levels of interest below:
- Pivot support is noted at 81.9218, 81.85, 81.7606
- Pivot resistance is noted at 82.083, 82.1724, 82.2442
| Levels | Levels.1 |
|---|---|
| Previous Daily High | 82.1005 |
| Previous Daily Low | 81.9393 |
| Previous Weekly High | 82.1725 |
| Previous Weekly Low | 81.8845 |
| Previous Monthly High | 82.9810 |
| Previous Monthly Low | 81.6435 |
| Daily Fibonacci 38.2% | 82.0009 |
| Daily Fibonacci 61.8% | 82.0389 |
| Daily Pivot Point S1 | 81.9218 |
| Daily Pivot Point S2 | 81.8500 |
| Daily Pivot Point S3 | 81.7606 |
| Daily Pivot Point R1 | 82.0830 |
| Daily Pivot Point R2 | 82.1724 |
| Daily Pivot Point R3 | 82.2442 |
[/s2If]
Nehcap Expert Advisor
The NEHCAP MT4 EA is high quality professional trading system geared to generate returns without using GRID or martingales. Each trade has strict risk per trade parameter. The pairs under management include EURUSD, GBPUSD, AUDCAD, AUDNZD,GBPAUD, EURAUD, EURCAD, CHFJPY and many more.
The system is trading live: LIVE ACCOUNT TRACKING
You can run it free. Apply for a free trial and track our account. Buy the system or use profit share mechanism to generate returns on your MT4.
Join Our Telegram Group
")


