The US dollar to Mexican peso exchange rate, currently at 17.0892, is increasing in value after a three-day decline at its lowest point in two weeks. According to a prediction by @nehcap, the recovery is expected to be minimal.
…
This is a premium post.
[s2If !current_user_can(access_s2member_level4)]Please register for FREE REGISTER to read full post below containing analysis. In case of any error or you think you are not able to read the full post below, please email us at support#nehcap.com [lwa][/s2If] [s2If current_user_can(access_s2member_level1)]
- USD/MXN picks up bids to snap three-day downtrend at the lowest level in a fortnight.
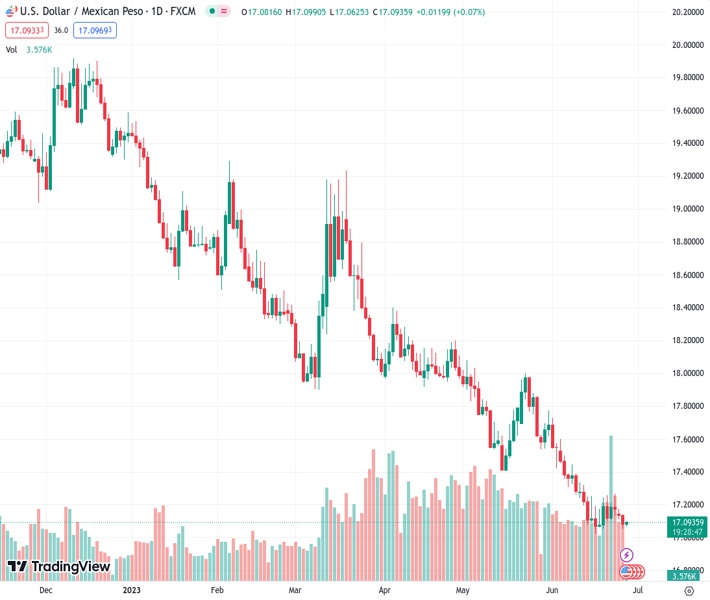
The pair currently trades last at 17.0892.
The previous day high was 17.1412 while the previous day low was 17.0544. The daily 38.2% Fib levels comes at 17.0876, expected to provide support. Similarly, the daily 61.8% fib level is at 17.1081, expected to provide resistance.
USD/MXN Price remains on the front foot around the intraday high near 17.10, printing the first daily gain in four amid early Wednesday. In doing so, the Mexican Peso (MXN) pair approaches the weekly resistance line surrounding 17.11 while justifying the upbeat RSI (14) line.
However, the 200-HMA and the previous support line from June 16, respectively close to 17.14 and 17.20, can restrict further upside of the USD/MXN pair.
Even if the
Trend: Limited recovery expected
Technical Levels: Supports and Resistances
USDMXN currently trading at 17.0919 at the time of writing. Pair opened at 17.0858 and is trading with a change of 0.04% % .
| Overview | Overview.1 | |
|---|---|---|
| 0 | Today last price | 17.0919 |
| 1 | Today Daily Change | 0.0061 |
| 2 | Today Daily Change % | 0.04% |
| 3 | Today daily open | 17.0858 |
The pair remains strongly bearish on the daily time frame. It trades below the 20 SMA @ 17.2742, 50 SMA 17.6005, 100 SMA @ 17.9813 and 200 SMA @ 18.7475.
| Trends | Trends.1 | |
|---|---|---|
| 0 | Daily SMA20 | 17.2742 |
| 1 | Daily SMA50 | 17.6005 |
| 2 | Daily SMA100 | 17.9813 |
| 3 | Daily SMA200 | 18.7475 |
The previous day high was 17.1412 while the previous day low was 17.0544. The daily 38.2% Fib levels comes at 17.0876, expected to provide support. Similarly, the daily 61.8% fib level is at 17.1081, expected to provide resistance.
Note the levels of interest below:
- Pivot support is noted at 17.0464, 17.0069, 16.9595
- Pivot resistance is noted at 17.1333, 17.1807, 17.2202
| Levels | Levels.1 |
|---|---|
| Previous Daily High | 17.1412 |
| Previous Daily Low | 17.0544 |
| Previous Weekly High | 17.2656 |
| Previous Weekly Low | 17.0610 |
| Previous Monthly High | 18.0780 |
| Previous Monthly Low | 17.4203 |
| Daily Fibonacci 38.2% | 17.0876 |
| Daily Fibonacci 61.8% | 17.1081 |
| Daily Pivot Point S1 | 17.0464 |
| Daily Pivot Point S2 | 17.0069 |
| Daily Pivot Point S3 | 16.9595 |
| Daily Pivot Point R1 | 17.1333 |
| Daily Pivot Point R2 | 17.1807 |
| Daily Pivot Point R3 | 17.2202 |
[/s2If]
Nehcap Expert Advisor
The NEHCAP MT4 EA is high quality professional trading system geared to generate returns without using GRID or martingales. Each trade has strict risk per trade parameter. The pairs under management include EURUSD, GBPUSD, AUDCAD, AUDNZD,GBPAUD, EURAUD, EURCAD, CHFJPY and many more.
The system is trading live: LIVE ACCOUNT TRACKING
You can run it free. Apply for a free trial and track our account. Buy the system or use profit share mechanism to generate returns on your MT4.
Join Our Telegram Group
")


