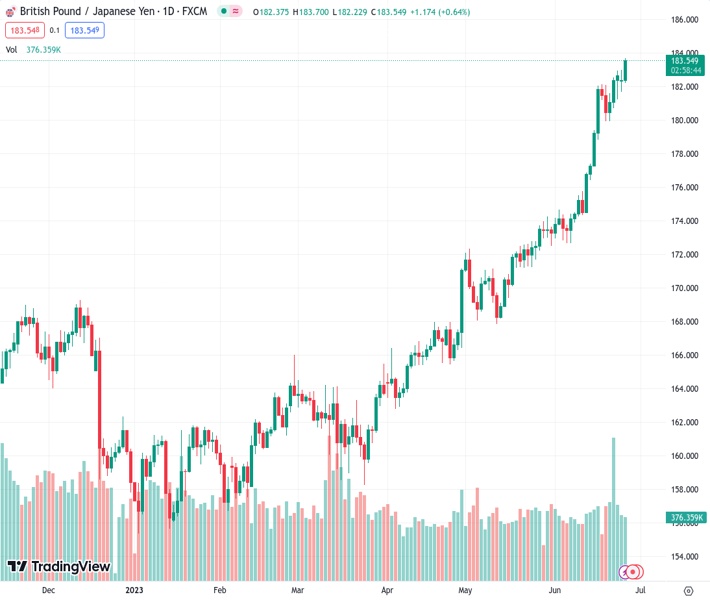
The GBPJPY pair has increased and is currently at 183.564, which is the highest it has been since December 2015, specifically at 183.70.
…
This is a premium post.
[s2If !current_user_can(access_s2member_level4)]Please register for FREE REGISTER to read full post below containing analysis. In case of any error or you think you are not able to read the full post below, please email us at support#nehcap.com [lwa][/s2If] [s2If current_user_can(access_s2member_level1)]
- The GBP/JPY rose to 183.70, its highest since December 2015.
The pair currently trades last at 183.564.
The previous day high was 183.0 while the previous day low was 181.69. The daily 38.2% Fib levels comes at 182.19, expected to provide support. Similarly, the daily 61.8% fib level is at 182.5, expected to provide support.
The GBP/JPY pair soared to its highest level since December 2015 at 183.70 on Tuesday. The appreciation of GBP can be attributed to several key factors, including the rise in Gilts ahead of the upcoming speeches by prominent figures such as Governor Andrew Bailey, Governor Kazuo Ueda, and Chairman Jerome Powell. Investors will look for clues regarding the main central banks’ next steps in their respective monetary policy movements.
After the Bank of England (BoE) surprised markets by announcing a 50 basis points hike and hinting at more rises in 2023, the Sterling gained significant interest. However, investors are worrying about the UK sliding into a recession, so any forward guidance or clues regarding the BoE’s next steps may generate volatility in Sterling’s price dynamics.
As for now, the 2-year British Bond yield rose to 5.23%, its highest since 2008 making the Pound trade with gains against some of its major rivals including the USD, CHF and JPY.
On the flip side, market participants will be watching Bank of Japan (BoJ) Governor Ueda’s Wednesday speech with interest. In the last June meeting, the BoJ maintained its ultra-dovish stance as their objective is to see wages increase rather than rein in inflation. In that sense, yield divergence and the BoJ stance made the JPY lose interest and weaken against most of its rivals.
According to the daily chart, the technical outlook for the GBP/JPY is clearly bullish in the short term. However, the cross tallied a fifth consecutive day of gains and its technical indicators continue to point at overbought conditions suggesting that a downwards correction may be on the horizon.
Resistance levels to watch: 184.00,184.50,185.00.
Support levels to watch: 182.50 ,181.70, 180.00.
Technical Levels: Supports and Resistances
GBPJPY currently trading at 183.66 at the time of writing. Pair opened at 182.42 and is trading with a change of 0.68 % .
| Overview | Overview.1 | |
|---|---|---|
| 0 | Today last price | 183.66 |
| 1 | Today Daily Change | 1.24 |
| 2 | Today Daily Change % | 0.68 |
| 3 | Today daily open | 182.42 |
The pair remains strongly bullish on the daily timeframe. It trades above its 20 SMA @ 177.36, 50 SMA 172.91, 100 SMA @ 167.76 and 200 SMA @ 165.63.
| Trends | Trends.1 | |
|---|---|---|
| 0 | Daily SMA20 | 177.36 |
| 1 | Daily SMA50 | 172.91 |
| 2 | Daily SMA100 | 167.76 |
| 3 | Daily SMA200 | 165.63 |
The previous day high was 183.0 while the previous day low was 181.69. The daily 38.2% Fib levels comes at 182.19, expected to provide support. Similarly, the daily 61.8% fib level is at 182.5, expected to provide support.
Note the levels of interest below:
- Pivot support is noted at 181.75, 181.07, 180.44
- Pivot resistance is noted at 183.05, 183.67, 184.35
| Levels | Levels.1 |
|---|---|
| Previous Daily High | 183.00 |
| Previous Daily Low | 181.69 |
| Previous Weekly High | 182.95 |
| Previous Weekly Low | 179.92 |
| Previous Monthly High | 174.28 |
| Previous Monthly Low | 167.84 |
| Daily Fibonacci 38.2% | 182.19 |
| Daily Fibonacci 61.8% | 182.50 |
| Daily Pivot Point S1 | 181.75 |
| Daily Pivot Point S2 | 181.07 |
| Daily Pivot Point S3 | 180.44 |
| Daily Pivot Point R1 | 183.05 |
| Daily Pivot Point R2 | 183.67 |
| Daily Pivot Point R3 | 184.35 |
[/s2If]
Nehcap Expert Advisor
The NEHCAP MT4 EA is high quality professional trading system geared to generate returns without using GRID or martingales. Each trade has strict risk per trade parameter. The pairs under management include EURUSD, GBPUSD, AUDCAD, AUDNZD,GBPAUD, EURAUD, EURCAD, CHFJPY and many more.
The system is trading live: LIVE ACCOUNT TRACKING
You can run it free. Apply for a free trial and track our account. Buy the system or use profit share mechanism to generate returns on your MT4.
Join Our Telegram Group
")


