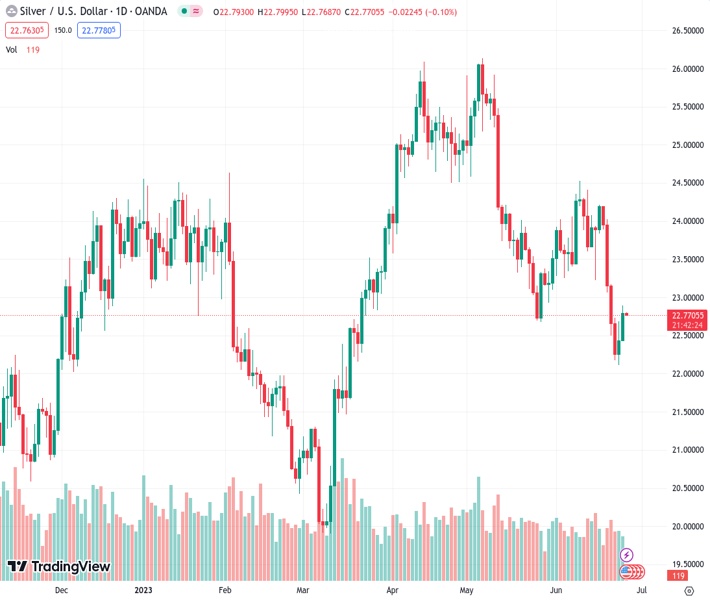
Silver is experiencing difficulty staying above the 200-day EMA and is trading with minimal movement near 22.765 for XAGUSD.
…
This is a premium post.
[s2If !current_user_can(access_s2member_level4)]Please register for FREE REGISTER to read full post below containing analysis. In case of any error or you think you are not able to read the full post below, please email us at support#nehcap.com [lwa][/s2If] [s2If current_user_can(access_s2member_level1)]
- Silver struggles below the 200-day EMA, trading nearly flat.
The pair currently trades last at 22.765.
The previous day high was 22.68 while the previous day low was 22.11. The daily 38.2% Fib levels comes at 22.47, expected to provide support. Similarly, the daily 61.8% fib level is at 22.33, expected to provide support.
Silver price advances sharply during the week, though as the Asian session begins, the XAG/USD is facing solid resistance at the 200-day Exponential Moving Average (EMA) at $22.94. That said, the Silver (XAG/USD) spot is trading at $22.77, almost flat, at the time of writing.
XAG/USD shifted bearish once it fell below the 200-day EMA and beneath the May 26 daily low of $22.68. Even though XAG/USD hovers above the latter, a daily close above it’s required to keep buyers hopeful of reclaiming higher prices, like the 200-day EMA, ahead of the $23.00 barrier.
Nevertheless, the XAG/USD’s path of least resistance is downward biased, as shown by the Relative Strength Index (RSI) indicator, at bearish territory. At the same time, the three-day Rate of Change (RoC) portrays some buying pressure lifted the XAG/USD.
That said, the XAG/USD first support would be $22.68. A breach of the latter will expose the XAG/USD last week’s low of $22.11 before dropping beneath the $22.00 mark. Conversely, if XAG/USD achieves a daily close above the 200-day EMA, the XAG/USD could challenge $23.00 as the first resistance. Break above will expose the 20-day EMA at $23.31, followed by the 100-day EMA at $23.45.
Technical Levels: Supports and Resistances
XAGUSD currently trading at 22.78 at the time of writing. Pair opened at 22.44 and is trading with a change of 1.52 % .
| Overview | Overview.1 | |
|---|---|---|
| 0 | Today last price | 22.78 |
| 1 | Today Daily Change | 0.34 |
| 2 | Today Daily Change % | 1.52 |
| 3 | Today daily open | 22.44 |
The pair is trading below its 20 Daily moving average @ 23.54, below its 50 Daily moving average @ 24.19 , below its 100 Daily moving average @ 23.32 and above its 200 Daily moving average @ 22.49
| Trends | Trends.1 | |
|---|---|---|
| 0 | Daily SMA20 | 23.54 |
| 1 | Daily SMA50 | 24.19 |
| 2 | Daily SMA100 | 23.32 |
| 3 | Daily SMA200 | 22.49 |
The previous day high was 22.68 while the previous day low was 22.11. The daily 38.2% Fib levels comes at 22.47, expected to provide support. Similarly, the daily 61.8% fib level is at 22.33, expected to provide support.
Note the levels of interest below:
- Pivot support is noted at 22.14, 21.84, 21.57
- Pivot resistance is noted at 22.71, 22.98, 23.28
| Levels | Levels.1 |
|---|---|
| Previous Daily High | 22.68 |
| Previous Daily Low | 22.11 |
| Previous Weekly High | 24.20 |
| Previous Weekly Low | 22.11 |
| Previous Monthly High | 26.14 |
| Previous Monthly Low | 22.68 |
| Daily Fibonacci 38.2% | 22.47 |
| Daily Fibonacci 61.8% | 22.33 |
| Daily Pivot Point S1 | 22.14 |
| Daily Pivot Point S2 | 21.84 |
| Daily Pivot Point S3 | 21.57 |
| Daily Pivot Point R1 | 22.71 |
| Daily Pivot Point R2 | 22.98 |
| Daily Pivot Point R3 | 23.28 |
[/s2If]
Nehcap Expert Advisor
The NEHCAP MT4 EA is high quality professional trading system geared to generate returns without using GRID or martingales. Each trade has strict risk per trade parameter. The pairs under management include EURUSD, GBPUSD, AUDCAD, AUDNZD,GBPAUD, EURAUD, EURCAD, CHFJPY and many more.
The system is trading live: LIVE ACCOUNT TRACKING
You can run it free. Apply for a free trial and track our account. Buy the system or use profit share mechanism to generate returns on your MT4.
Join Our Telegram Group
")


