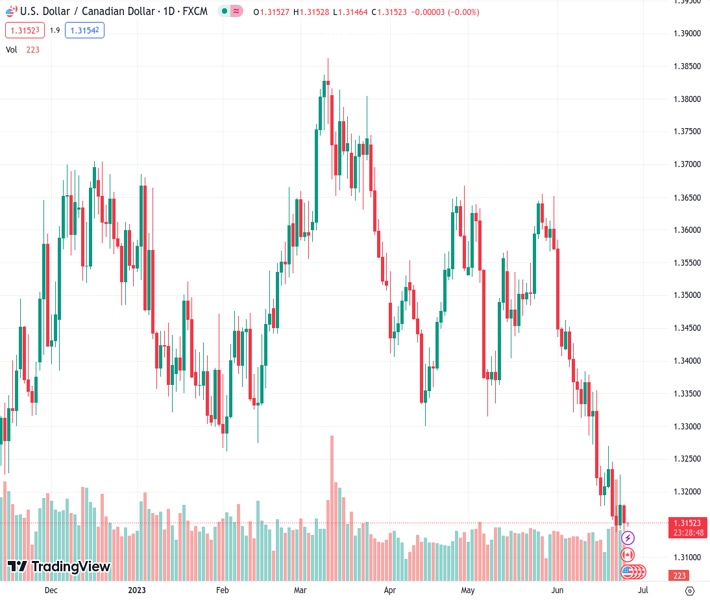
The USDCAD pair fluctuated between 1.3136 and 1.3184, reaching a record low not seen since September 2022.
…
This is a premium post.
[s2If !current_user_can(access_s2member_level4)]Please register for FREE REGISTER to read full post below containing analysis. In case of any error or you think you are not able to read the full post below, please email us at support#nehcap.com [lwa][/s2If] [s2If current_user_can(access_s2member_level1)]
- The USD/CAD traded in the 1.3136 – 1.3184 range, setting a new low since September 2022.
The pair currently trades last at 1.31489.
The previous day high was 1.3226 while the previous day low was 1.3143. The daily 38.2% Fib levels comes at 1.3194, expected to provide resistance. Similarly, the daily 61.8% fib level is at 1.3175, expected to provide resistance.
The USD/CAD pair faced downward pressure as the US Dollar weakened, declining to a low of 1.3136, its lowest level since September 2022. Furthermore, the focus shifts to the release of Canadian inflation figures on Tuesday, which are expected to have decelerated in May. Moreover, investors await Jerome Powell’s upcoming speech at the ECB’s forum on Wednesday, which could provide further direction for the market.
On Tuesday, the Bank of Canada will release inflation figures for May, which are expected to show a deceleration. The headline inflation per the Consumer Price Index (CPI) is seen falling to 3.4% YoY while the Core measures to 3.9% YoY. The CPI measure is a key gauge of inflation for central banks, which tends to influence monetary policy decisions. Hot figures are usually associated with interest rate hikes.
On the other hand, investors will look for clues in Wednesday’s speech by Jerome Powell in the ECB’s forum. The markets are eagerly trying to decipher the fact that Federal Open Market (FOMC) members as per the revised dot plots, are seeing an additional 50 basis points (bps) hike in 2023. In that sense, any hawkish surprise will give a boost to the US Dollar whose DXY index is currently trading with losses at the 102.78 area.
In addition, mid-tier economic data released on Tuesday, including Durable Goods data from May may have an impact on the Greenback’s price dynamics.
Technically speaking, the USD/CAD maintains a bearish outlook for the short term, as per indicators on the daily chart. The Relative Strength Index (RSI) and Moving Average Convergence Divergence (MACD) are both showing weakness, standing in negative territory approaching oversold conditions. Moreover, the pair trades below its main moving averages, indicating that the sellers have the upper hand.
On the downside, the next support levels to watch are the daily low at 1.3136, followed by the 1.3115 zone and the psychological mark at 1.3100. Conversely, upcoming resistance for the pair is seen at the 1.3170 level, followed by the 1.3190 and 1.3200 areas.
Technical Levels: Supports and Resistances
USDCAD currently trading at 1.3152 at the time of writing. Pair opened at 1.3183 and is trading with a change of -0.24 % .
| Overview | Overview.1 | |
|---|---|---|
| 0 | Today last price | 1.3152 |
| 1 | Today Daily Change | -0.0031 |
| 2 | Today Daily Change % | -0.2400 |
| 3 | Today daily open | 1.3183 |
The pair remains strongly bearish on the daily time frame. It trades below the 20 SMA @ 1.3347, 50 SMA 1.3446, 100 SMA @ 1.3505 and 200 SMA @ 1.3519.
| Trends | Trends.1 | |
|---|---|---|
| 0 | Daily SMA20 | 1.3347 |
| 1 | Daily SMA50 | 1.3446 |
| 2 | Daily SMA100 | 1.3505 |
| 3 | Daily SMA200 | 1.3519 |
The previous day high was 1.3226 while the previous day low was 1.3143. The daily 38.2% Fib levels comes at 1.3194, expected to provide resistance. Similarly, the daily 61.8% fib level is at 1.3175, expected to provide resistance.
Note the levels of interest below:
- Pivot support is noted at 1.3142, 1.3101, 1.306
- Pivot resistance is noted at 1.3225, 1.3267, 1.3308
| Levels | Levels.1 |
|---|---|
| Previous Daily High | 1.3226 |
| Previous Daily Low | 1.3143 |
| Previous Weekly High | 1.3270 |
| Previous Weekly Low | 1.3139 |
| Previous Monthly High | 1.3655 |
| Previous Monthly Low | 1.3315 |
| Daily Fibonacci 38.2% | 1.3194 |
| Daily Fibonacci 61.8% | 1.3175 |
| Daily Pivot Point S1 | 1.3142 |
| Daily Pivot Point S2 | 1.3101 |
| Daily Pivot Point S3 | 1.3060 |
| Daily Pivot Point R1 | 1.3225 |
| Daily Pivot Point R2 | 1.3267 |
| Daily Pivot Point R3 | 1.3308 |
[/s2If]
Nehcap Expert Advisor
The NEHCAP MT4 EA is high quality professional trading system geared to generate returns without using GRID or martingales. Each trade has strict risk per trade parameter. The pairs under management include EURUSD, GBPUSD, AUDCAD, AUDNZD,GBPAUD, EURAUD, EURCAD, CHFJPY and many more.
The system is trading live: LIVE ACCOUNT TRACKING
You can run it free. Apply for a free trial and track our account. Buy the system or use profit share mechanism to generate returns on your MT4.
Join Our Telegram Group
")


