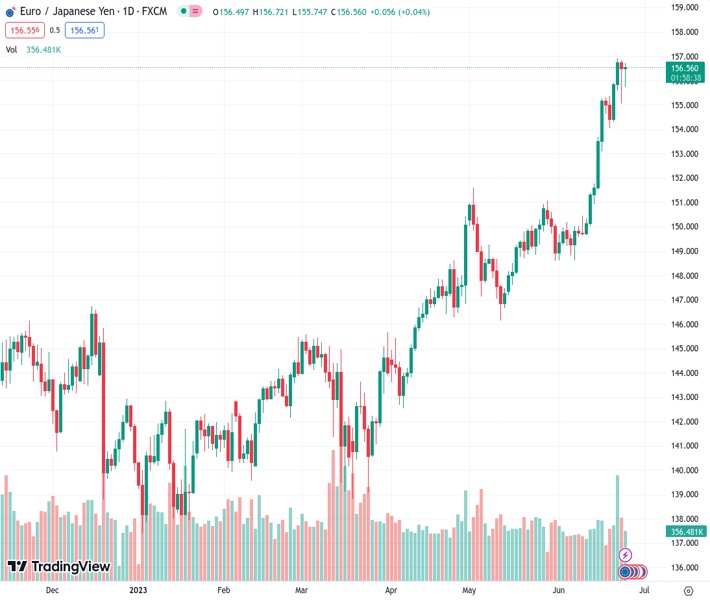
The EURJPY at 156.563 experienced a drop to below the 156.30 area but later rebounded to 156.55.
…
This is a premium post.
[s2If !current_user_can(access_s2member_level4)]Please register for FREE REGISTER to read full post below containing analysis. In case of any error or you think you are not able to read the full post below, please email us at support#nehcap.com [lwa][/s2If] [s2If current_user_can(access_s2member_level1)]
- EUR/JPY retreated below 156.30 area and then recovered to 156.55.
The pair currently trades last at 156.563.
The previous day high was 156.83 while the previous day low was 155.06. The daily 38.2% Fib levels comes at 155.73, expected to provide support. Similarly, the daily 61.8% fib level is at 156.15, expected to provide support.
At the beginning of the week, the EUR/JPY stabilized at 156.55. German IFO data from June came in below the consensus while investors’ focus shifted to Wednesday’s speeches of main central bankers at the European Central Bank’s (ECB) annual Forum in Sintra, Portugal. In that sense, most participants will look for clues regarding the next steps of the main bank’s monetary policies.
The CESifo Group released IFO survey data from Germany in June, which acts as an early indicator of current conditions and business expectations for the next six months.he Business Climate Index came in at 88.5 vs the 90.7 expected, while the Expectations Index at 83.6 vs the 88 expected. The Current assessment lived up to expectations, coming in at 93.7, above the consensus of 93.5, but was lower than the previous month’s print.
As a result, German yields have weakened across the curve as investors have taken refuge in Bonds. The 10-year Bund yield fell to 2.31%, while the 2-year yield now sits at 3.14% and the 5-year is yielding 2.48%, after a 1.69% slide, respectively. On Tuesday and Wednesday, Christine Lagarde will deliver speeches, where investors will look to decipher the next steps of the ECB’s monetary policy.
On the other hand, according to a Reuters’ poll, the majority of the economists interviewed believe that the Bank of Japan (BoJ) will intervene to stop the Yen’s fall if the USD/JPY reaches 145.00. As for now, the pair trades at 143.15, and the JPY weakens amid soft inflation figures and the ultra-dovish stance by the BoJ.
Technically speaking, the EUR/JPY maintains a bullish outlook for the short term, as per indicators on the daily chart, but indicators still point at overbought conditions. The Relative Strength Index (RSI) holds a negative slope above 70, while the Moving Average Convergence Divergence (MACD) prints green but decreasing bars in its histogram.
A move above the 156.90 area would suggest a continuation of the bullish trend for EUR/JPY, with the next resistances at the 157.50 zone and psychological mark at 158.00. On the other hand, on the downside, the next support levels to watch are the 155.50 zone, followed by the 155.00 area and the 154.00 level.
Technical Levels: Supports and Resistances
EURJPY currently trading at 156.59 at the time of writing. Pair opened at 156.65 and is trading with a change of -0.04 % .
| Overview | Overview.1 | |
|---|---|---|
| 0 | Today last price | 156.59 |
| 1 | Today Daily Change | -0.06 |
| 2 | Today Daily Change % | -0.04 |
| 3 | Today daily open | 156.65 |
The pair remains strongly bullish on the daily timeframe. It trades above its 20 SMA @ 151.89, 50 SMA 149.87, 100 SMA @ 146.62 and 200 SMA @ 144.8.
| Trends | Trends.1 | |
|---|---|---|
| 0 | Daily SMA20 | 151.89 |
| 1 | Daily SMA50 | 149.87 |
| 2 | Daily SMA100 | 146.62 |
| 3 | Daily SMA200 | 144.80 |
The previous day high was 156.83 while the previous day low was 155.06. The daily 38.2% Fib levels comes at 155.73, expected to provide support. Similarly, the daily 61.8% fib level is at 156.15, expected to provide support.
Note the levels of interest below:
- Pivot support is noted at 155.53, 154.41, 153.76
- Pivot resistance is noted at 157.3, 157.95, 159.07
| Levels | Levels.1 |
|---|---|
| Previous Daily High | 156.83 |
| Previous Daily Low | 155.06 |
| Previous Weekly High | 156.93 |
| Previous Weekly Low | 154.05 |
| Previous Monthly High | 151.62 |
| Previous Monthly Low | 146.14 |
| Daily Fibonacci 38.2% | 155.73 |
| Daily Fibonacci 61.8% | 156.15 |
| Daily Pivot Point S1 | 155.53 |
| Daily Pivot Point S2 | 154.41 |
| Daily Pivot Point S3 | 153.76 |
| Daily Pivot Point R1 | 157.30 |
| Daily Pivot Point R2 | 157.95 |
| Daily Pivot Point R3 | 159.07 |
[/s2If]
Nehcap Expert Advisor
The NEHCAP MT4 EA is high quality professional trading system geared to generate returns without using GRID or martingales. Each trade has strict risk per trade parameter. The pairs under management include EURUSD, GBPUSD, AUDCAD, AUDNZD,GBPAUD, EURAUD, EURCAD, CHFJPY and many more.
The system is trading live: LIVE ACCOUNT TRACKING
You can run it free. Apply for a free trial and track our account. Buy the system or use profit share mechanism to generate returns on your MT4.
Join Our Telegram Group
")


