The USDJPY pair declines as apprehensions about the worldwide economy and geopolitical occurrences continue to persist, currently trading at 143.550.
…
This is a premium post.
[s2If !current_user_can(access_s2member_level4)]Please register for FREE REGISTER to read full post below containing analysis. In case of any error or you think you are not able to read the full post below, please email us at support#nehcap.com [lwa][/s2If] [s2If current_user_can(access_s2member_level1)]
- USD/JPY trades lower as concerns over the global economy and geopolitical events linger.
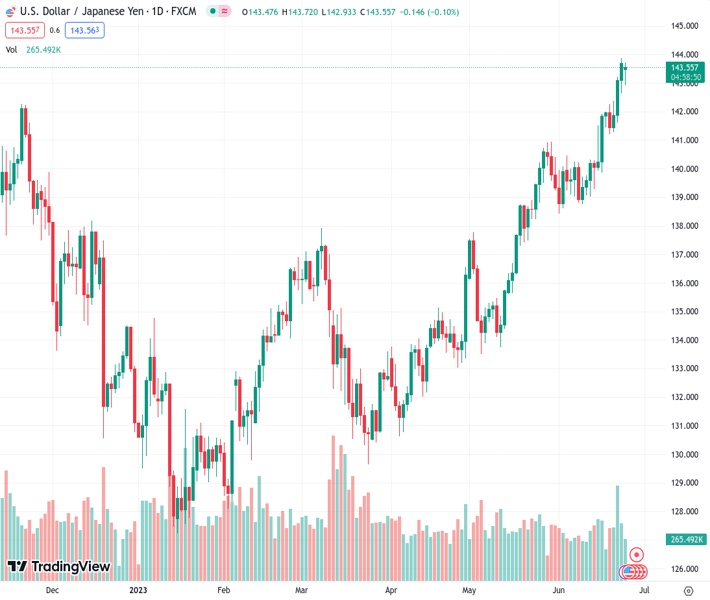
The pair currently trades last at 143.550.
The previous day high was 143.87 while the previous day low was 142.69. The daily 38.2% Fib levels comes at 143.42, expected to provide support. Similarly, the daily 61.8% fib level is at 143.14, expected to provide support.
USD/JPY stays firm at around the 143.40s area after diving towards a daily low of 142.93 on renewed concerns of a global economic slowdown amidst over-the-weekend geopolitical events weighed on investors’ mood. At the time of writing, the USD/JPY exchanges hand at 143.46, down 0.16%.
US equities shifted negatively, while the Japanese Yen (JPY) strengthened on Japanese authorities’ comments regarding excessive currency moves. A light Monday economic calendar in the United States (US), with the release of the Dallas Fed Manufacturing Index in June plunging to -23.2, showed some improvement but remained in recessionary territory. Although it continues to contract, it was the most significant advance in three months.
In the meantime, traders disregarded the chance for a US Federal Reserve (Fed) interest rate cut, as shown by the CME FedWatch Tool. Nonetheless, market players expect one interest rate increase of a quarter of a percentage point, contrary to two foreseen by Fed officials, with July odds at 74.4%, as shown in the CME FedWatch Tool.
Meanwhile, tussles between Russian mercenaries and Putin’s military ended on Sunday after the Wagner Group army stopped its advance to Moscow, threatening to remove incompetent and corrupt Russian commanders that he blames for botching the war.
Aside from this, the Vice Finance Minister for Internation Affairs, Masato Kanda, commented the recent Yen weakening was too “rapid and one-sided.” That helped offset previous Yen losses and sent the USD/JPY tumbling toward its low of 142.93 before recovering some lost ground.
In addition, falling US Treasury bond yields lent a lifeline to the JPY, as the 10-year Treasury note yields 3.717%, down two and a half basis points (bps), a headwind for the greenback, and the USD/JPY. The US Dollar Index, a basket of six currencies against the US Dollar (USD), drops 0.17% to 102.699.
From a technical perspective, the USD/JPY is set to record additional gains after breaching resistance at the November 22 daily high of 142.24. That exacerbated the USD/JPY rise above 143.00 toward a year-to-date (YTD) high of 143.878. But verbal intervention by Japanese authorities triggered a correction. Nevertheless, if USD/JPY surpasses 144.00, the next stop would be last year-s October 27 daily low of 145.10, ahead of rallying to the November 10 daily high at 146.59. Conversely, the USD/JPY must fall below 143.00 and 142.24 to prolog its losses towards sold support at the 20-day Exponential Moving Average (EMA) at 140.90.
Technical Levels: Supports and Resistances
USDJPY currently trading at 143.48 at the time of writing. Pair opened at 143.68 and is trading with a change of -0.14 % .
| Overview | Overview.1 | |
|---|---|---|
| 0 | Today last price | 143.48 |
| 1 | Today Daily Change | -0.20 |
| 2 | Today Daily Change % | -0.14 |
| 3 | Today daily open | 143.68 |
The pair remains strongly bullish on the daily timeframe. It trades above its 20 SMA @ 140.51, 50 SMA 137.81, 100 SMA @ 135.64 and 200 SMA @ 137.21.
| Trends | Trends.1 | |
|---|---|---|
| 0 | Daily SMA20 | 140.51 |
| 1 | Daily SMA50 | 137.81 |
| 2 | Daily SMA100 | 135.64 |
| 3 | Daily SMA200 | 137.21 |
The previous day high was 143.87 while the previous day low was 142.69. The daily 38.2% Fib levels comes at 143.42, expected to provide support. Similarly, the daily 61.8% fib level is at 143.14, expected to provide support.
Note the levels of interest below:
- Pivot support is noted at 142.96, 142.23, 141.77
- Pivot resistance is noted at 144.14, 144.6, 145.32
| Levels | Levels.1 |
|---|---|
| Previous Daily High | 143.87 |
| Previous Daily Low | 142.69 |
| Previous Weekly High | 143.87 |
| Previous Weekly Low | 141.21 |
| Previous Monthly High | 140.93 |
| Previous Monthly Low | 133.50 |
| Daily Fibonacci 38.2% | 143.42 |
| Daily Fibonacci 61.8% | 143.14 |
| Daily Pivot Point S1 | 142.96 |
| Daily Pivot Point S2 | 142.23 |
| Daily Pivot Point S3 | 141.77 |
| Daily Pivot Point R1 | 144.14 |
| Daily Pivot Point R2 | 144.60 |
| Daily Pivot Point R3 | 145.32 |
[/s2If]
Nehcap Expert Advisor
The NEHCAP MT4 EA is high quality professional trading system geared to generate returns without using GRID or martingales. Each trade has strict risk per trade parameter. The pairs under management include EURUSD, GBPUSD, AUDCAD, AUDNZD,GBPAUD, EURAUD, EURCAD, CHFJPY and many more.
The system is trading live: LIVE ACCOUNT TRACKING
You can run it free. Apply for a free trial and track our account. Buy the system or use profit share mechanism to generate returns on your MT4.
Join Our Telegram Group
")


