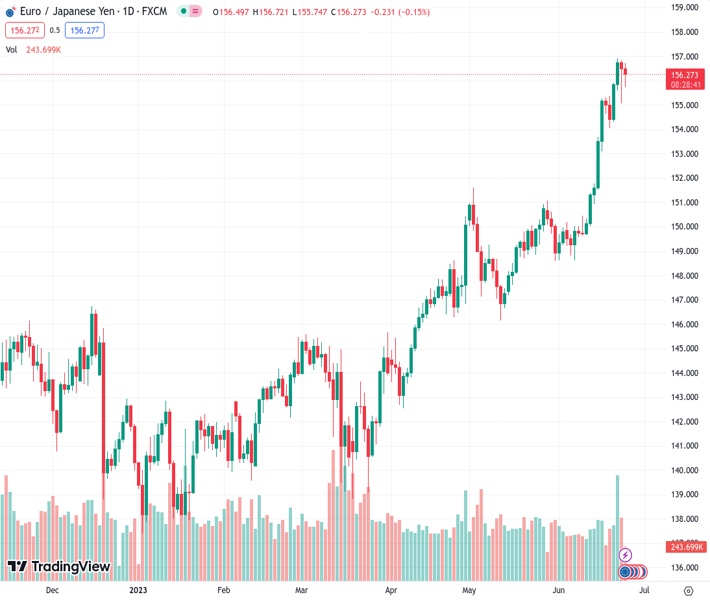
The EURJPY pair at a rate of 156.281 continues its decline from Friday’s level of approximately 156.40.
…
This is a premium post.
[s2If !current_user_can(access_s2member_level4)]Please register for FREE REGISTER to read full post below containing analysis. In case of any error or you think you are not able to read the full post below, please email us at support#nehcap.com [lwa][/s2If] [s2If current_user_can(access_s2member_level1)]
- EUR/JPY adds to Friday’s pullback around 156.40.
The pair currently trades last at 156.281.
The previous day high was 156.83 while the previous day low was 155.06. The daily 38.2% Fib levels comes at 155.73, expected to provide support. Similarly, the daily 61.8% fib level is at 156.15, expected to provide support.
EUR/JPY faces some renewed downside pressure and retreats from recent multi-year peaks in levels just shy of the 157.00 barrier.
In the meantime, further gains appear on the cards, while a clear breakout of the 2023 high at 156.93 (June 22) should meet the next relevant hurdle not before the weekly high of 163.09 (August 22 2008).
The ongoing overbought conditions of the cross, however, are indicative that a deeper knee-jerk should not be ruled out at some point in the short-term horizon.
So far, further upside looks favoured while the cross trades above the 200-day SMA, today at 144.82.
Technical Levels: Supports and Resistances
EURJPY currently trading at 156.38 at the time of writing. Pair opened at 156.65 and is trading with a change of -0.17 % .
| Overview | Overview.1 | |
|---|---|---|
| 0 | Today last price | 156.38 |
| 1 | Today Daily Change | 98.00 |
| 2 | Today Daily Change % | -0.17 |
| 3 | Today daily open | 156.65 |
The pair remains strongly bullish on the daily timeframe. It trades above its 20 SMA @ 151.89, 50 SMA 149.87, 100 SMA @ 146.62 and 200 SMA @ 144.8.
| Trends | Trends.1 | |
|---|---|---|
| 0 | Daily SMA20 | 151.89 |
| 1 | Daily SMA50 | 149.87 |
| 2 | Daily SMA100 | 146.62 |
| 3 | Daily SMA200 | 144.80 |
The previous day high was 156.83 while the previous day low was 155.06. The daily 38.2% Fib levels comes at 155.73, expected to provide support. Similarly, the daily 61.8% fib level is at 156.15, expected to provide support.
Note the levels of interest below:
- Pivot support is noted at 155.53, 154.41, 153.76
- Pivot resistance is noted at 157.3, 157.95, 159.07
| Levels | Levels.1 |
|---|---|
| Previous Daily High | 156.83 |
| Previous Daily Low | 155.06 |
| Previous Weekly High | 156.93 |
| Previous Weekly Low | 154.05 |
| Previous Monthly High | 151.62 |
| Previous Monthly Low | 146.14 |
| Daily Fibonacci 38.2% | 155.73 |
| Daily Fibonacci 61.8% | 156.15 |
| Daily Pivot Point S1 | 155.53 |
| Daily Pivot Point S2 | 154.41 |
| Daily Pivot Point S3 | 153.76 |
| Daily Pivot Point R1 | 157.30 |
| Daily Pivot Point R2 | 157.95 |
| Daily Pivot Point R3 | 159.07 |
[/s2If]
Nehcap Expert Advisor
The NEHCAP MT4 EA is high quality professional trading system geared to generate returns without using GRID or martingales. Each trade has strict risk per trade parameter. The pairs under management include EURUSD, GBPUSD, AUDCAD, AUDNZD,GBPAUD, EURAUD, EURCAD, CHFJPY and many more.
The system is trading live: LIVE ACCOUNT TRACKING
You can run it free. Apply for a free trial and track our account. Buy the system or use profit share mechanism to generate returns on your MT4.
Join Our Telegram Group
")


