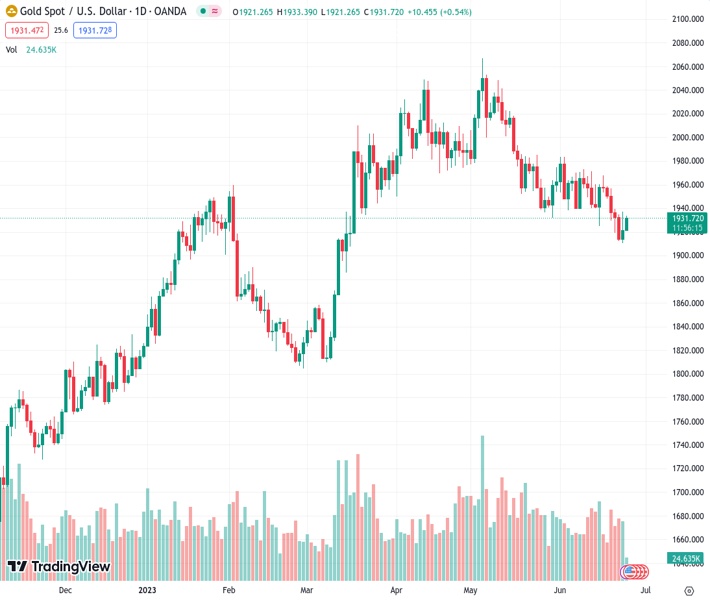
On Monday, the price of gold, represented by #XAUUSD trading at 1,931.73, experienced growth and positive momentum for the second day in a row.
…
This is a premium post.
[s2If !current_user_can(access_s2member_level4)]Please register for FREE REGISTER to read full post below containing analysis. In case of any error or you think you are not able to read the full post below, please email us at support#nehcap.com [lwa][/s2If] [s2If current_user_can(access_s2member_level1)]
- Gold price gains some positive traction for the second successive day on Monday.
The pair currently trades last at 1931.73.
The previous day high was 1937.45 while the previous day low was 1910.18. The daily 38.2% Fib levels comes at 1927.03, expected to provide support. Similarly, the daily 61.8% fib level is at 1920.6, expected to provide support.
Gold price attracts some buying for the second successive day on Monday and trades with a mild positive bias through the early European session. The XAU/USD is currently placed just above the $1,930 level, up nearly 0.60% for the day, though remains well within Friday’s broader trading range and below the 100-day Simple Moving Average (SMA) support breakpoint.
Against the backdrop of worries about a global economic slowdown, a revolt by Russian mercenaries over the weekend raised concerns about political instability in the country and lends some support to the safe-haven Gold price. It is worth recalling that a clash between Moscow and the Russian mercenary group Wagner was averted on Saturday after the heavily armed mercenaries withdrew from the southern Russian city of Rostov under a deal that halted their rapid advance on the capital. Apart from this, the emergence of some selling around the US Dollar (USD) turns out to be another factor acting as a tailwind for the XAU/USD.
Following two days of goodish recovery from the lowest level since May 11, the USD kicks off the new week on a softer note in the wake of a modest downtick in the US Treasury bond yields. That said, the Federal Reserve’s (Fed) signal that borrowing costs may still need to rise as much as 50 bps by the end of this year should limit the downside for the US bond yields and the USD. Apart from this, a more hawkish stance adopted by global major central banks might further contribute to capping gains for the non-yielding Gold price and warrants some caution before positioning for any further near-term appreciating move.
In the absence of any relevant market-moving economic releases on Monday, the aforementioned fundamental backdrop makes it prudent to wait for strong follow-through buying before confirming that the XAU/USD has formed a near-term bottom. Traders might also refrain from placing aggressive bets ahead of Fed Chair Jerome Powell’s speech on Wednesday. Investors this week will further confront the release of important US macro data, including the Core PCE Price Index (the Fed’s preferred inflation gauge). This will influence Fed rate-hike expectations and provide a fresh directional impetus to Gold price.
Technical Levels: Supports and Resistances
XAUUSD currently trading at 1932.27 at the time of writing. Pair opened at 1920.8 and is trading with a change of 0.6 % .
| Overview | Overview.1 | |
|---|---|---|
| 0 | Today last price | 1932.27 |
| 1 | Today Daily Change | 11.47 |
| 2 | Today Daily Change % | 0.60 |
| 3 | Today daily open | 1920.80 |
The pair is trading below its 20 Daily moving average @ 1949.86, below its 50 Daily moving average @ 1977.31 , below its 100 Daily moving average @ 1942.17 and above its 200 Daily moving average @ 1853.37
| Trends | Trends.1 | |
|---|---|---|
| 0 | Daily SMA20 | 1949.86 |
| 1 | Daily SMA50 | 1977.31 |
| 2 | Daily SMA100 | 1942.17 |
| 3 | Daily SMA200 | 1853.37 |
The previous day high was 1937.45 while the previous day low was 1910.18. The daily 38.2% Fib levels comes at 1927.03, expected to provide support. Similarly, the daily 61.8% fib level is at 1920.6, expected to provide support.
Note the levels of interest below:
- Pivot support is noted at 1908.17, 1895.54, 1880.9
- Pivot resistance is noted at 1935.44, 1950.08, 1962.71
| Levels | Levels.1 |
|---|---|
| Previous Daily High | 1937.45 |
| Previous Daily Low | 1910.18 |
| Previous Weekly High | 1958.85 |
| Previous Weekly Low | 1910.18 |
| Previous Monthly High | 2079.76 |
| Previous Monthly Low | 1932.12 |
| Daily Fibonacci 38.2% | 1927.03 |
| Daily Fibonacci 61.8% | 1920.60 |
| Daily Pivot Point S1 | 1908.17 |
| Daily Pivot Point S2 | 1895.54 |
| Daily Pivot Point S3 | 1880.90 |
| Daily Pivot Point R1 | 1935.44 |
| Daily Pivot Point R2 | 1950.08 |
| Daily Pivot Point R3 | 1962.71 |
[/s2If]
Nehcap Expert Advisor
The NEHCAP MT4 EA is high quality professional trading system geared to generate returns without using GRID or martingales. Each trade has strict risk per trade parameter. The pairs under management include EURUSD, GBPUSD, AUDCAD, AUDNZD,GBPAUD, EURAUD, EURCAD, CHFJPY and many more.
The system is trading live: LIVE ACCOUNT TRACKING
You can run it free. Apply for a free trial and track our account. Buy the system or use profit share mechanism to generate returns on your MT4.
Join Our Telegram Group
")


