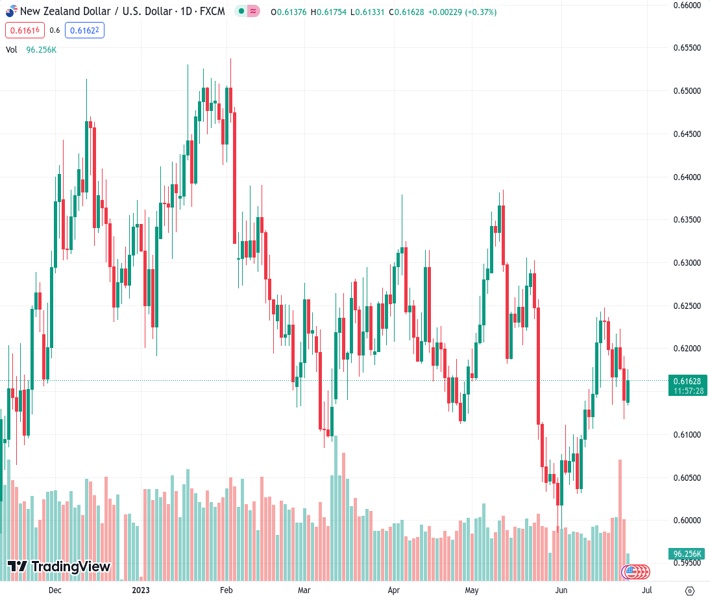
The NZDUSD, currently at 0.61623, has found some temporary support around 0.6140. Nevertheless, due to the prevailing uncertainty, a further decline in the exchange rate appears to be more likely.
…
This is a premium post.
[s2If !current_user_can(access_s2member_level4)]Please register for FREE REGISTER to read full post below containing analysis. In case of any error or you think you are not able to read the full post below, please email us at support#nehcap.com [lwa][/s2If] [s2If current_user_can(access_s2member_level1)]
- NZD/USD has gauged intermediate support near 0.6140, however, more downside seems favored amid uncertainty.
The pair currently trades last at 0.61623.
The previous day high was 0.6192 while the previous day low was 0.6116. The daily 38.2% Fib levels comes at 0.6145, expected to provide support. Similarly, the daily 61.8% fib level is at 0.6163, expected to provide resistance.
The NZD/USD pair has found intermediate support near 0.6140 in the European session. The Kiwi asset is expected to show a volatile action as the US Dollar Index (DXY) is looking to conclude its corrective move.
S&P500 futures have posted losses in London, portraying a further decline in the risk appetite of the market participants. The risk of global recession is driving market mood and has trimmed the appeal for risk-sensitive assets.
The US Dollar will remain in action ahead of the release of the Durable Goods Orders data. Investors should note that core inflation in the United States economy has remained extremely persistent due to rising prices for services and durable goods.
NZD/USD has formed a Head and Shoulder chart pattern on a two-hour scale, which indicates a prolonged consolidation. A breakdown of the same confirms a bearish reversal. The neckline of the aforementioned chart pattern is plotted from June 14 low at 0.6142.
The Kiwi asset is struggling to maintain an auction above the 200-period Exponential Moving Average (EMA) at 0.6159, which indicates that the long-term trend is not bullish.
Meanwhile, the Relative Strength Index (RSI) (14) is oscillating in the 40.00-60.00 range, indicating a non-directional performance.
A downside move below the June 16 low at 0.6116 will expose the asset to June 05 low at 0.6041. A slippage below the latter would expose the asset to psychological support at 0.6000.
Alternatively, a confident break above May 17 high at 0.6261 will drive the Kiwi asset toward May 19 high at 0.6306 followed by May 08 high around 0.6360.
Technical Levels: Supports and Resistances
NZDUSD currently trading at 0.616 at the time of writing. Pair opened at 0.6118 and is trading with a change of 0.69 % .
| Overview | Overview.1 | |
|---|---|---|
| 0 | Today last price | 0.6160 |
| 1 | Today Daily Change | 0.0042 |
| 2 | Today Daily Change % | 0.6900 |
| 3 | Today daily open | 0.6118 |
The pair is trading above its 20 Daily moving average @ 0.6124, below its 50 Daily moving average @ 0.6173 , below its 100 Daily moving average @ 0.6205 and above its 200 Daily moving average @ 0.6156
| Trends | Trends.1 | |
|---|---|---|
| 0 | Daily SMA20 | 0.6124 |
| 1 | Daily SMA50 | 0.6173 |
| 2 | Daily SMA100 | 0.6205 |
| 3 | Daily SMA200 | 0.6156 |
The previous day high was 0.6192 while the previous day low was 0.6116. The daily 38.2% Fib levels comes at 0.6145, expected to provide support. Similarly, the daily 61.8% fib level is at 0.6163, expected to provide resistance.
Note the levels of interest below:
- Pivot support is noted at 0.6092, 0.6067, 0.6017
- Pivot resistance is noted at 0.6168, 0.6217, 0.6243
| Levels | Levels.1 |
|---|---|
| Previous Daily High | 0.6192 |
| Previous Daily Low | 0.6116 |
| Previous Weekly High | 0.6237 |
| Previous Weekly Low | 0.6116 |
| Previous Monthly High | 0.6385 |
| Previous Monthly Low | 0.5985 |
| Daily Fibonacci 38.2% | 0.6145 |
| Daily Fibonacci 61.8% | 0.6163 |
| Daily Pivot Point S1 | 0.6092 |
| Daily Pivot Point S2 | 0.6067 |
| Daily Pivot Point S3 | 0.6017 |
| Daily Pivot Point R1 | 0.6168 |
| Daily Pivot Point R2 | 0.6217 |
| Daily Pivot Point R3 | 0.6243 |
[/s2If]
Nehcap Expert Advisor
The NEHCAP MT4 EA is high quality professional trading system geared to generate returns without using GRID or martingales. Each trade has strict risk per trade parameter. The pairs under management include EURUSD, GBPUSD, AUDCAD, AUDNZD,GBPAUD, EURAUD, EURCAD, CHFJPY and many more.
The system is trading live: LIVE ACCOUNT TRACKING
You can run it free. Apply for a free trial and track our account. Buy the system or use profit share mechanism to generate returns on your MT4.
Join Our Telegram Group
")


