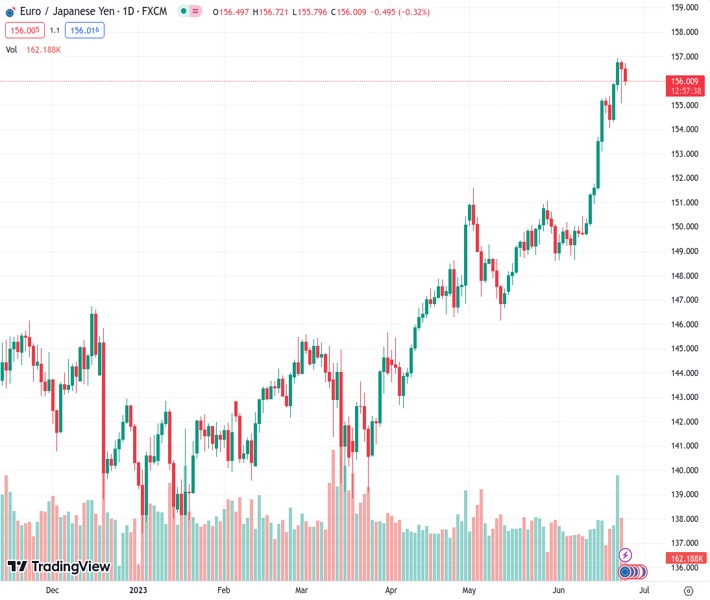
EURJPY at 156.050 is encountering persistent selling pressure for the second consecutive day on Monday.
…
This is a premium post.
[s2If !current_user_can(access_s2member_level4)]Please register for FREE REGISTER to read full post below containing analysis. In case of any error or you think you are not able to read the full post below, please email us at support#nehcap.com [lwa][/s2If] [s2If current_user_can(access_s2member_level1)]
- EUR/JPY remains under some selling pressure for the second straight day on Monday.
The pair currently trades last at 156.050.
The previous day high was 156.83 while the previous day low was 155.06. The daily 38.2% Fib levels comes at 155.73, expected to provide support. Similarly, the daily 61.8% fib level is at 156.15, expected to provide resistance.
The EUR/JPY cross struggles to capitalize on Friday’s goodish intraday bounce from the 155.00 psychological mark and kicks off the new week on a softer note. The selling bias picks up pace during the early European session and drags spot prices back below the 156.00 mark in the last hour.
Friday’s disappointing flash Eurozone PMIs added to worries about economic headwinds stemming from rising borrowing costs and could leave the European Central Bank (ECB) in a policy dilemma. This, in turn, is seen as a key factor behind the shared currency’s relative underperformance, which, along with a pickup in demand for the Japanese Yen (JPY), turn out to be key factors exerting some pressure on the EUR/JPY cross.
Japan’s top currency diplomat Masato Kanda stepped up warnings against the recent weakness in the JPY and told reporters that Japan will not rule out any options available to respond appropriately to excessive currency moves. Furthermore, Japanese Finance Minister Shunichi Suzuki said that we will continue to watch the forex market with a sense of urgency, fueling speculations that authorities could intervene to stem JPY’s weakness.
Moreover, the Bank of Japan (BoJ), in the Summary of Opinions from the June policy meeting, noted that there is a strong chance that inflation will moderate toward the middle of the current fiscal year, but won’t slow back below 2%. Moreover, one of the board members said that the BoJ should discuss revising its controversial yield curve control (YCC) policy at an early stage. This further benefits the JPY and weighs on the EUR/JPY cross.
However, expectations that BoJ’s negative interest-rate policy will remain in place at least until next year might hold back traders from placing aggressive bullish bets around the EUR/JPY cross. It is worth recalling that BoJ Governor Kazuo Ueda recently ruled out the possibility of any change in ultra-loose policy settings. This marks a big divergence in comparison to the ECB’s hawkish stance and should lend support to the EUR/JPY cross.
Apart from this, a generally positive tone around the equity markets could undermine the safe-haven JPY and contribute to limiting any meaningful corrective decline in the absence of any relevant market-moving data from the Eurozone. This makes it prudent to wait for strong follow-through selling around the EUR/JPY cross before confirming that the recent rally to the highest level since September 2008 has run out of steam.
Technical Levels: Supports and Resistances
EURJPY currently trading at 156.1 at the time of writing. Pair opened at 156.65 and is trading with a change of -0.35 % .
| Overview | Overview.1 | |
|---|---|---|
| 0 | Today last price | 156.10 |
| 1 | Today Daily Change | -0.55 |
| 2 | Today Daily Change % | -0.35 |
| 3 | Today daily open | 156.65 |
The pair remains strongly bullish on the daily timeframe. It trades above its 20 SMA @ 151.89, 50 SMA 149.87, 100 SMA @ 146.62 and 200 SMA @ 144.8.
| Trends | Trends.1 | |
|---|---|---|
| 0 | Daily SMA20 | 151.89 |
| 1 | Daily SMA50 | 149.87 |
| 2 | Daily SMA100 | 146.62 |
| 3 | Daily SMA200 | 144.80 |
The previous day high was 156.83 while the previous day low was 155.06. The daily 38.2% Fib levels comes at 155.73, expected to provide support. Similarly, the daily 61.8% fib level is at 156.15, expected to provide resistance.
Note the levels of interest below:
- Pivot support is noted at 155.53, 154.41, 153.76
- Pivot resistance is noted at 157.3, 157.95, 159.07
| Levels | Levels.1 |
|---|---|
| Previous Daily High | 156.83 |
| Previous Daily Low | 155.06 |
| Previous Weekly High | 156.93 |
| Previous Weekly Low | 154.05 |
| Previous Monthly High | 151.62 |
| Previous Monthly Low | 146.14 |
| Daily Fibonacci 38.2% | 155.73 |
| Daily Fibonacci 61.8% | 156.15 |
| Daily Pivot Point S1 | 155.53 |
| Daily Pivot Point S2 | 154.41 |
| Daily Pivot Point S3 | 153.76 |
| Daily Pivot Point R1 | 157.30 |
| Daily Pivot Point R2 | 157.95 |
| Daily Pivot Point R3 | 159.07 |
[/s2If]
Nehcap Expert Advisor
The NEHCAP MT4 EA is high quality professional trading system geared to generate returns without using GRID or martingales. Each trade has strict risk per trade parameter. The pairs under management include EURUSD, GBPUSD, AUDCAD, AUDNZD,GBPAUD, EURAUD, EURCAD, CHFJPY and many more.
The system is trading live: LIVE ACCOUNT TRACKING
You can run it free. Apply for a free trial and track our account. Buy the system or use profit share mechanism to generate returns on your MT4.
Join Our Telegram Group
")


