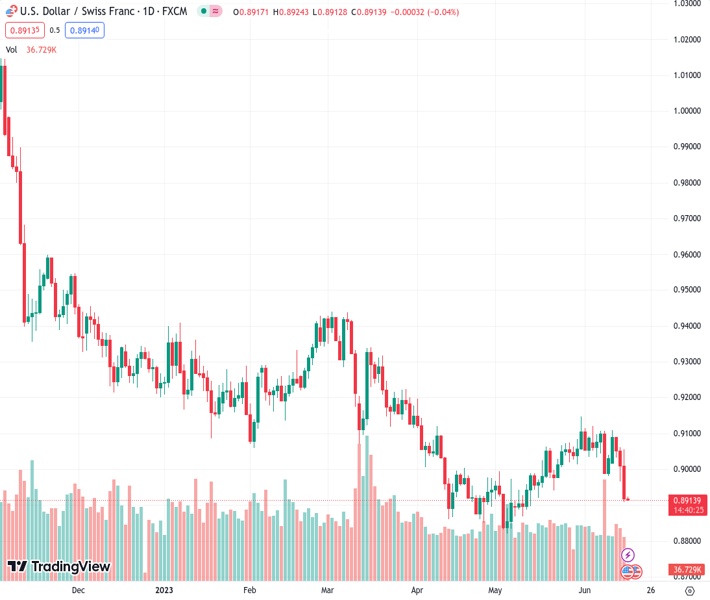
The currency pair USDCHF is currently trading at 0.89135 and is nursing losses at its lowest position seen in the last five weeks. According to the perspective of @nehcap, there are predictions of more downward movement in the future.
…
This is a premium post.
[s2If !current_user_can(access_s2member_level4)]Please register for FREE REGISTER to read full post below containing analysis. In case of any error or you think you are not able to read the full post below, please email us at support#nehcap.com [lwa][/s2If] [s2If current_user_can(access_s2member_level1)]
- USD/CHF licks its wounds at the lowest levels in five weeks.
The pair currently trades last at 0.89135.
The previous day high was 0.9056 while the previous day low was 0.8907. The daily 38.2% Fib levels comes at 0.8964, expected to provide resistance. Similarly, the daily 61.8% fib level is at 0.8999, expected to provide resistance.
USD/CHF bears take a breather at the monthly low, defensive near 0.8920 heading into Friday’s European session, after posting a stellar fall to convince sellers the previous day.
The Swiss Franc (CHF) pair dropped the most in a week while breaking the key technical supports to convince bears in refreshing the multi-day bottom. Also keeping the USD/CHF sellers hopeful are the bearish MACD signals.
It’s worth noting that the below 50.0 levels of the RSI (14) line suggests bottom picking and hence challenging the USD/CHF bears of late.
Even so, there prevails no barrier for the quote before it tests a two-month-old horizontal support zone near 0.8865-60.
Following that, the yearly low of around 0.8820 can act as an extra filter toward the south while the 61.8% Fibonacci Expansion (FE) of its March-May moves, near 0.8765, can lure the pair sellers afterward.
Meanwhile, the USD/CHF buyers may initially aim for the 50-DMA support-turned-resistance of around 0.8985, a break of which could direct the price to the 0.9000 round figure.
However, the bottom line of the six-week-old rising trend channel, around 0.9015, can act as the final check for the USD/CHF bulls before allowing them to return home.
Trend: Further downside expected
Technical Levels: Supports and Resistances
USDCHF currently trading at 0.8918 at the time of writing. Pair opened at 0.8919 and is trading with a change of -0.01% % .
| Overview | Overview.1 | |
|---|---|---|
| 0 | Today last price | 0.8918 |
| 1 | Today Daily Change | -0.0001 |
| 2 | Today Daily Change % | -0.01% |
| 3 | Today daily open | 0.8919 |
The pair remains strongly bearish on the daily time frame. It trades below the 20 SMA @ 0.9042, 50 SMA 0.8985, 100 SMA @ 0.9112 and 200 SMA @ 0.9343.
| Trends | Trends.1 | |
|---|---|---|
| 0 | Daily SMA20 | 0.9042 |
| 1 | Daily SMA50 | 0.8985 |
| 2 | Daily SMA100 | 0.9112 |
| 3 | Daily SMA200 | 0.9343 |
The previous day high was 0.9056 while the previous day low was 0.8907. The daily 38.2% Fib levels comes at 0.8964, expected to provide resistance. Similarly, the daily 61.8% fib level is at 0.8999, expected to provide resistance.
Note the levels of interest below:
- Pivot support is noted at 0.8865, 0.8812, 0.8716
- Pivot resistance is noted at 0.9014, 0.911, 0.9163
| Levels | Levels.1 |
|---|---|
| Previous Daily High | 0.9056 |
| Previous Daily Low | 0.8907 |
| Previous Weekly High | 0.9120 |
| Previous Weekly Low | 0.8984 |
| Previous Monthly High | 0.9148 |
| Previous Monthly Low | 0.8820 |
| Daily Fibonacci 38.2% | 0.8964 |
| Daily Fibonacci 61.8% | 0.8999 |
| Daily Pivot Point S1 | 0.8865 |
| Daily Pivot Point S2 | 0.8812 |
| Daily Pivot Point S3 | 0.8716 |
| Daily Pivot Point R1 | 0.9014 |
| Daily Pivot Point R2 | 0.9110 |
| Daily Pivot Point R3 | 0.9163 |
[/s2If]
Nehcap Expert Advisor
The NEHCAP MT4 EA is high quality professional trading system geared to generate returns without using GRID or martingales. Each trade has strict risk per trade parameter. The pairs under management include EURUSD, GBPUSD, AUDCAD, AUDNZD,GBPAUD, EURAUD, EURCAD, CHFJPY and many more.
The system is trading live: LIVE ACCOUNT TRACKING
You can run it free. Apply for a free trial and track our account. Buy the system or use profit share mechanism to generate returns on your MT4.
Join Our Telegram Group


