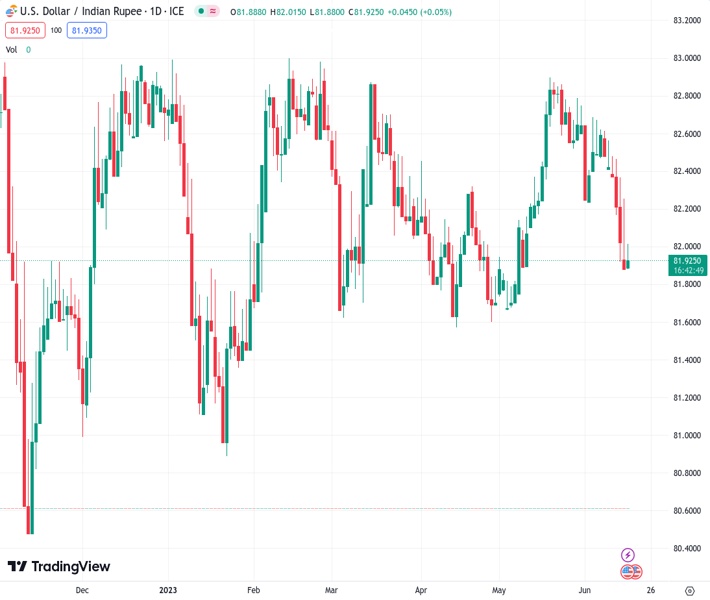
The currency pair USDINR, which was at 81.9250, reduced its gains during the day and went back to the low level that was observed in the previous day.
…
This is a premium post.
[s2If !current_user_can(access_s2member_level4)]Please register for FREE REGISTER to read full post below containing analysis. In case of any error or you think you are not able to read the full post below, please email us at support#nehcap.com [lwa][/s2If] [s2If current_user_can(access_s2member_level1)]
- USD/INR pares intraday gains to revisit multi-day low marked the previous day.
The pair currently trades last at 81.9250.
The previous day high was 82.2746 while the previous day low was 81.8708. The daily 38.2% Fib levels comes at 82.0251, expected to provide resistance. Similarly, the daily 61.8% fib level is at 82.1204, expected to provide resistance.
USD/INR remains on the back foot at the lowest levels in five weeks, fading bounce off intraday low to 81.95 early Friday morning in Europe. In doing so, the Indian Rupee (INR) pair cheers the US Dollar’s inability to justify the hawkish Fed halt, as well as the latest retreat in the Oil price, amid doubt about the July rate hike from the US central bank. Also, the risk-on mood in the Asia-Pacific markets weighs on the prices.
US Dollar Index (DXY) grinds near 102.20-30 while struggling to pare the biggest daily loss in three months. In doing so, the greenback’s gauge versus the six major currencies justifies the previous day’s mixed US data that challenge the Fed’s indirect commitment to lift the benchmark rates in July.
Talking about the data, US Retail Sales growth marked an increase of 0.3% for May versus -0.1% expected and 0.4% previous readings while the Core readings, mean Retail Sales ex Autos, match 0.1% market forecasts for the said month, compared to 0.4% prior.
Meanwhile, NY Fed Empire State Manufacturing Index jumps to 6.6 in June versus -15.1 expected and -31.8 prior whereas Philadelphia Fed Manufacturing Index drops to -13.7 for the said month from -10.4 prior and compared to -14 market forecasts. On the same line, US Industrial Production for May cools down to -0.2% against 0.1% estimated and 0.5% prior while Initial Jobless Claims reprints the upwardly revised figures of 262K for the week ended on June 09 versus 249K expected.
It should be noted that the WTI crude oil grinds near a one-week high, mildly offered near $70.70 by the press time, as energy traders seek more clues to convince buyers amid mixed concerns about China’s recovery. “UBS cuts China growth forecast to 5.2% after disappointing data,” said Bloomberg.
Looking ahead, the preliminary readings of the Michigan Consumer Sentiment Index (CSI) and five-year inflation expectations for June will be important for fresh impulse ahead of next week’s Fed Chair Jerome Powell’s testimony.
A seven-month-old ascending support line, around 81.90 by the press time, restricts immediate USD/INR downside ahead of the double bottoms marked near 81.50. The pair’s recovery moves can take clues from the RSI but remain elusive unless crossing the month-start bottom of around 82.30.
Technical Levels: Supports and Resistances
USDINR currently trading at 81.9538 at the time of writing. Pair opened at 81.908 and is trading with a change of 0.06% % .
| Overview | Overview.1 | |
|---|---|---|
| 0 | Today last price | 81.9538 |
| 1 | Today Daily Change | 0.0458 |
| 2 | Today Daily Change % | 0.06% |
| 3 | Today daily open | 81.908 |
The pair remains strongly bearish on the daily time frame. It trades below the 20 SMA @ 82.5177, 50 SMA 82.2044, 100 SMA @ 82.2796 and 200 SMA @ 82.0391.
| Trends | Trends.1 | |
|---|---|---|
| 0 | Daily SMA20 | 82.5177 |
| 1 | Daily SMA50 | 82.2044 |
| 2 | Daily SMA100 | 82.2796 |
| 3 | Daily SMA200 | 82.0391 |
The previous day high was 82.2746 while the previous day low was 81.8708. The daily 38.2% Fib levels comes at 82.0251, expected to provide resistance. Similarly, the daily 61.8% fib level is at 82.1204, expected to provide resistance.
Note the levels of interest below:
- Pivot support is noted at 81.761, 81.614, 81.3571
- Pivot resistance is noted at 82.1648, 82.4217, 82.5687
| Levels | Levels.1 |
|---|---|
| Previous Daily High | 82.2746 |
| Previous Daily Low | 81.8708 |
| Previous Weekly High | 82.7120 |
| Previous Weekly Low | 82.4030 |
| Previous Monthly High | 82.9810 |
| Previous Monthly Low | 81.6435 |
| Daily Fibonacci 38.2% | 82.0251 |
| Daily Fibonacci 61.8% | 82.1204 |
| Daily Pivot Point S1 | 81.7610 |
| Daily Pivot Point S2 | 81.6140 |
| Daily Pivot Point S3 | 81.3571 |
| Daily Pivot Point R1 | 82.1648 |
| Daily Pivot Point R2 | 82.4217 |
| Daily Pivot Point R3 | 82.5687 |
[/s2If]
Nehcap Expert Advisor
The NEHCAP MT4 EA is high quality professional trading system geared to generate returns without using GRID or martingales. Each trade has strict risk per trade parameter. The pairs under management include EURUSD, GBPUSD, AUDCAD, AUDNZD,GBPAUD, EURAUD, EURCAD, CHFJPY and many more.
The system is trading live: LIVE ACCOUNT TRACKING
You can run it free. Apply for a free trial and track our account. Buy the system or use profit share mechanism to generate returns on your MT4.
Join Our Telegram Group


