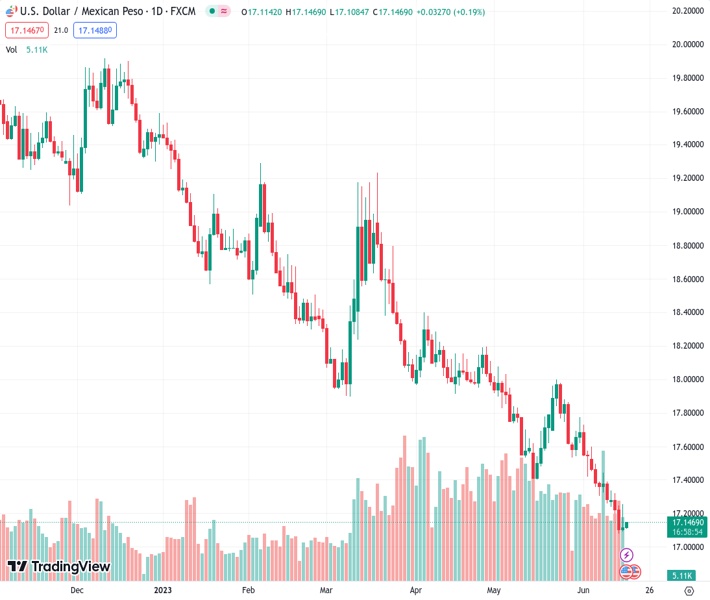
The USDMXN currency pair, currently at 17.1444, is fluctuating within a narrow range slightly above the multi-year low that was reached earlier this week.
…
This is a premium post.
[s2If !current_user_can(access_s2member_level4)]Please register for FREE REGISTER to read full post below containing analysis. In case of any error or you think you are not able to read the full post below, please email us at support#nehcap.com [lwa][/s2If] [s2If current_user_can(access_s2member_level1)]
- USD/MXN oscillates in a range just above the multi-year low touched earlier this week.
The pair currently trades last at 17.1444.
The previous day high was 17.2555 while the previous day low was 17.1029. The daily 38.2% Fib levels comes at 17.1972, expected to provide resistance. Similarly, the daily 61.8% fib level is at 17.1612, expected to provide resistance.
The USD/MXN pair continues with its struggle to register any meaningful recovery from the lowest level since May 2016, albeit manages to hold its neck above the 17.00 mark through the Asian session on Friday.
From a technical perspective, the USD/MXN pair has been drifting lower along a downward-sloping channel extending from the vicinity of the 18.00 mark touched on May 23. This points to a well-established short-term bearish trend and suggests that the path of least resistance for spot prices is to the downside. The lack of buying interest reaffirms the negative bias and indicates that the downward trajectory witnessed over the past four weeks or so is still far from being over.
That said, the Relative Strength Index (RSI) on the daily chart is flashing slightly oversold conditions and holding back traders from placing fresh bearish bets. This, in turn, assists the USD/MXN pair to defend
support marked by the lower end of the aforementioned trend channel. Hence, it will be prudent to wait for a sustained break and acceptance below the 17.00 mark, or the trend-channel support, before positioning for a further depreciating move.
On the flip side, any meaningful recovery attempt is likely to confront resistance near the overnight swing high, around the 17.25 area. This is closely followed by the trend-channel resistance, around the 17.35 region, which if cleared decisively might trigger a short-covering rally. The USD/MXN pair might then climb to the 17.70 intermediate resistance en route to the 18.00 mark. Some follow-through buying will suggest that spot prices have formed a near-term bottom.
Technical Levels: Supports and Resistances
USDMXN currently trading at 17.1434 at the time of writing. Pair opened at 17.121 and is trading with a change of 0.13 % .
| Overview | Overview.1 | |
|---|---|---|
| 0 | Today last price | 17.1434 |
| 1 | Today Daily Change | 0.0224 |
| 2 | Today Daily Change % | 0.1300 |
| 3 | Today daily open | 17.1210 |
The pair remains strongly bearish on the daily time frame. It trades below the 20 SMA @ 17.5305, 50 SMA 17.7523, 100 SMA @ 18.117 and 200 SMA @ 18.861.
| Trends | Trends.1 | |
|---|---|---|
| 0 | Daily SMA20 | 17.5305 |
| 1 | Daily SMA50 | 17.7523 |
| 2 | Daily SMA100 | 18.1170 |
| 3 | Daily SMA200 | 18.8610 |
The previous day high was 17.2555 while the previous day low was 17.1029. The daily 38.2% Fib levels comes at 17.1972, expected to provide resistance. Similarly, the daily 61.8% fib level is at 17.1612, expected to provide resistance.
Note the levels of interest below:
- Pivot support is noted at 17.0642, 17.0073, 16.9116
- Pivot resistance is noted at 17.2167, 17.3124, 17.3693
| Levels | Levels.1 |
|---|---|
| Previous Daily High | 17.2555 |
| Previous Daily Low | 17.1029 |
| Previous Weekly High | 17.5981 |
| Previous Weekly Low | 17.2591 |
| Previous Monthly High | 18.0780 |
| Previous Monthly Low | 17.4203 |
| Daily Fibonacci 38.2% | 17.1972 |
| Daily Fibonacci 61.8% | 17.1612 |
| Daily Pivot Point S1 | 17.0642 |
| Daily Pivot Point S2 | 17.0073 |
| Daily Pivot Point S3 | 16.9116 |
| Daily Pivot Point R1 | 17.2167 |
| Daily Pivot Point R2 | 17.3124 |
| Daily Pivot Point R3 | 17.3693 |
[/s2If]
Nehcap Expert Advisor
The NEHCAP MT4 EA is high quality professional trading system geared to generate returns without using GRID or martingales. Each trade has strict risk per trade parameter. The pairs under management include EURUSD, GBPUSD, AUDCAD, AUDNZD,GBPAUD, EURAUD, EURCAD, CHFJPY and many more.
The system is trading live: LIVE ACCOUNT TRACKING
You can run it free. Apply for a free trial and track our account. Buy the system or use profit share mechanism to generate returns on your MT4.
Join Our Telegram Group


