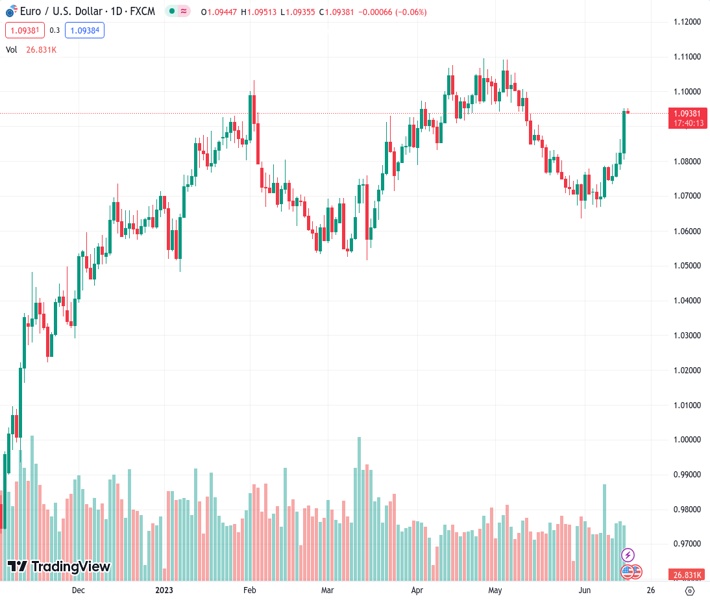
The bulls at EURUSD, currently at 1.09381, have lost their momentum at the horizontal resistance level that has been in place for seven weeks. It is anticipated that there will be a pullback. This is the opinion of @nehcap.
…
This is a premium post.
[s2If !current_user_can(access_s2member_level4)]Please register for FREE REGISTER to read full post below containing analysis. In case of any error or you think you are not able to read the full post below, please email us at support#nehcap.com [lwa][/s2If] [s2If current_user_can(access_s2member_level1)]
- EUR/USD bulls run out of steam inside seven-week-old horizontal resistance region.
The pair currently trades last at 1.09381.
The previous day high was 1.0953 while the previous day low was 1.0804. The daily 38.2% Fib levels comes at 1.0896, expected to provide support. Similarly, the daily 61.8% fib level is at 1.0861, expected to provide support.
EUR/USD treads water around mid-1.0900s during a sluggish early Friday morning in Europe. In doing so, the Euro pair struggles to extend the previous day’s run-up, the biggest since early February, while making rounds to a five-week high.
That said, the pair rallied the previous day as the European Central Bank (ECB) marked a hawkish play to beat Wednesday’s Federal Reserve (Fed) announcements. The latest inaction, however, appears to lack clear catalysts amid a light calendar and cautious mood ahead of the final readings of Eurozone inflation data for May, as per the Harmonized Index of Consumer Prices (HICP) details. Additionally important will be the preliminary readings of the Michigan Consumer Sentiment Index (CSI) for June and five-year inflation expectations.
Also read: EUR/USD grinds at five-week top around 1.0950 as Euro bulls seek more clues of ECB vs. Fed play
Technically, a horizontal resistance zone comprising multiple levels marked since April 24, between 1.0965 and 1.0940, restricts immediate EUR/USD moves amid the overbought RSI.
Even if the quote manages to cross the 1.0965 hurdle, the 78.6% Fibonacci retracement level of its previous monthly fall, around the 1.1000 psychological magnet, can challenge the EUR/USD bulls ahead of directing them to the yearly high of near 1.1100 marked in April.
On the contrary, a downside break of the 1.0940 immediate support can drag the EUR/USD price to the 61.8% Fibonacci retracement surrounding the 1.0920 level. Following that, the 50% Fibonacci retracement level near 1.0865 may lure the Euro bears.
It should be noted, however, that the EUR/USD buyers should remain hopeful unless witnessing a clear downside break of the 1.0825-20 support confluence including the 200-SMA and an ascending trend line from June 07.
Trend: Pullback expected
Technical Levels: Supports and Resistances
EURUSD currently trading at 1.0943 at the time of writing. Pair opened at 1.0945 and is trading with a change of -0.02% % .
| Overview | Overview.1 | |
|---|---|---|
| 0 | Today last price | 1.0943 |
| 1 | Today Daily Change | -0.0002 |
| 2 | Today Daily Change % | -0.02% |
| 3 | Today daily open | 1.0945 |
The pair remains strongly bullish on the daily timeframe. It trades above its 20 SMA @ 1.0757, 50 SMA 1.0878, 100 SMA @ 1.0806 and 200 SMA @ 1.0538.
| Trends | Trends.1 | |
|---|---|---|
| 0 | Daily SMA20 | 1.0757 |
| 1 | Daily SMA50 | 1.0878 |
| 2 | Daily SMA100 | 1.0806 |
| 3 | Daily SMA200 | 1.0538 |
The previous day high was 1.0953 while the previous day low was 1.0804. The daily 38.2% Fib levels comes at 1.0896, expected to provide support. Similarly, the daily 61.8% fib level is at 1.0861, expected to provide support.
Note the levels of interest below:
- Pivot support is noted at 1.0848, 1.0752, 1.07
- Pivot resistance is noted at 1.0997, 1.1049, 1.1146
| Levels | Levels.1 |
|---|---|
| Previous Daily High | 1.0953 |
| Previous Daily Low | 1.0804 |
| Previous Weekly High | 1.0787 |
| Previous Weekly Low | 1.0667 |
| Previous Monthly High | 1.1092 |
| Previous Monthly Low | 1.0635 |
| Daily Fibonacci 38.2% | 1.0896 |
| Daily Fibonacci 61.8% | 1.0861 |
| Daily Pivot Point S1 | 1.0848 |
| Daily Pivot Point S2 | 1.0752 |
| Daily Pivot Point S3 | 1.0700 |
| Daily Pivot Point R1 | 1.0997 |
| Daily Pivot Point R2 | 1.1049 |
| Daily Pivot Point R3 | 1.1146 |
[/s2If]
Nehcap Expert Advisor
The NEHCAP MT4 EA is high quality professional trading system geared to generate returns without using GRID or martingales. Each trade has strict risk per trade parameter. The pairs under management include EURUSD, GBPUSD, AUDCAD, AUDNZD,GBPAUD, EURAUD, EURCAD, CHFJPY and many more.
The system is trading live: LIVE ACCOUNT TRACKING
You can run it free. Apply for a free trial and track our account. Buy the system or use profit share mechanism to generate returns on your MT4.
Join Our Telegram Group


