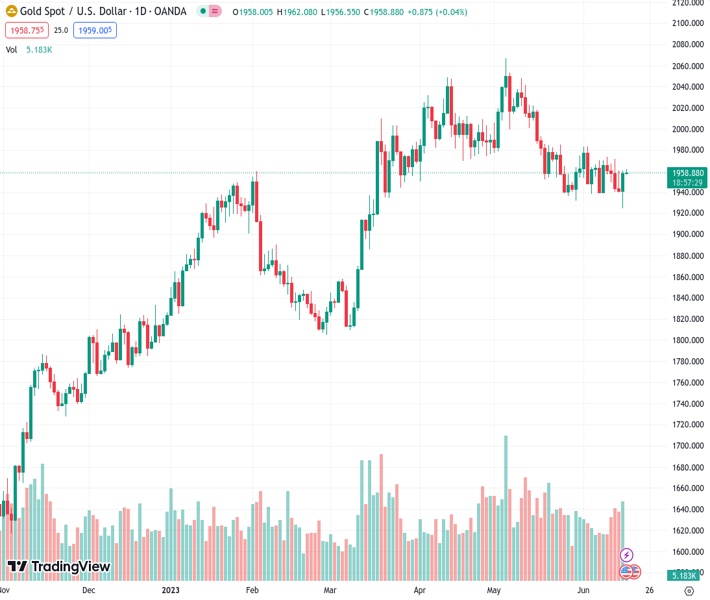
On Friday, during the Asian session, the price of gold, indicated by XAUUSD at 1,959.25, remained within a restricted trading range.
…
This is a premium post.
[s2If !current_user_can(access_s2member_level4)]Please register for FREE REGISTER to read full post below containing analysis. In case of any error or you think you are not able to read the full post below, please email us at support#nehcap.com [lwa][/s2If] [s2If current_user_can(access_s2member_level1)]
- Gold price oscillates in a narrow trading band through the Asian session on Friday.
The pair currently trades last at 1959.25.
The previous day high was 1960.31 while the previous day low was 1924.85. The daily 38.2% Fib levels comes at 1946.76, expected to provide support. Similarly, the daily 61.8% fib level is at 1938.4, expected to provide support.
Gold price struggles to capitalize on the previous day’s goodish rebound from the $1,925-$1,924 area, or its lowest level since March 17 and oscillates in a narrow trading band through the Asian session on Friday. The XAU/USD is currently placed just above the $1,955 level and remains well within a familiar trading range held over the month or so.
The US Dollar (USD) struggles to register any meaningful recovery and languishes near a five-week low amid expectations that the Federal Reserve (Fed) is nearing the end of its year-long rate-hiking cycle. This led to the overnight slump in the US Treasury bond yields, which keeps the USD bulls on the defensive and is seen acting as a tailwind for the US Dollar-denominated Gold price. Any meaningful upside, however, remains elusive in the wake of a more hawkish outlook by major central banks.
It is worth recalling that the Reserve Bank of Australia (RBA) and the Bank of Canada (BoC) delivered a surprise 25 basis point (bps) rate hike last week, suggesting that the fight against inflation is not over yet. Furthermore, the Fed signalled this week that borrowing costs may still need to rise by as much as 50 bps by the end of this year. The European Central Bank (ECB) also lifted rates by 25 bps, to the highest level in 22 years, and indicated further tightening to bring Eurozone inflation to its 2% target.
Adding to this, the Bank of England (BoE) is also expected to be far more aggressive in policy tightening to contain stubbornly high inflation, which, at an 8.7% YoY rate in April, is still running at more than four times the central bank’s 2% target. This might hold back traders from placing aggressive bullish bets around the non-yielding Gold price. Apart from this, a generally positive tone around the equity markets might further contribute to capping gains for the safe-haven XAU/USD, at least for now.
The aforementioned fundamental backdrop makes it prudent to wait for strong follow-through buying before confirming that the Gold price has formed a near-term bottom. In the absence of any relevant market-moving economic releases from the United States (US), traders will take cues from Fed Governor Christopher Waller’s public appearance. This, along with the US bond yields, might influence the USD. Apart from this, the broader risk sentiment could provide some impetus to the XAU/USD.
From a technical perspective, the recent repeated failures to find bearish acceptance below the 100-day Simple Moving Average (SMA) warrants some caution before positioning for further losses. That said, any subsequent move up is likely to confront resistance near the $1,962-$1,964 region ahead of the $1,970-$1,972 supply zone. This is followed by the $1,983-$1,985 hurdle, above which the Gold price could reclaim the $2,000 psychological mark and climb further to the next relevant resistance near the $2,010-$2,012 region.
On the flip side, the 100-day SMA, currently pegged near the $1,942-$1,940 area, now seems to protect the immediate downside ahead of the $1,932 region and the overnight swing low, around the $1,925-$1,924 zone. Some follow-through selling will be seen as a fresh trigger for bearish traders and make the Gold price vulnerable to accelerate the fall towards the $1,900 round figure. The downward trajectory could get extended further and drag the XAU/USD towards the $1,876-$1,875 horizontal support en route to the very important 200-day SMA, currently around the $1,839 region.
Technical Levels: Supports and Resistances
XAUUSD currently trading at 1957.66 at the time of writing. Pair opened at 1958.12 and is trading with a change of -0.02 % .
| Overview | Overview.1 | |
|---|---|---|
| 0 | Today last price | 1957.66 |
| 1 | Today Daily Change | -0.46 |
| 2 | Today Daily Change % | -0.02 |
| 3 | Today daily open | 1958.12 |
The pair is trading below its 20 Daily moving average @ 1957.79, below its 50 Daily moving average @ 1986.32 , above its 100 Daily moving average @ 1941.79 and above its 200 Daily moving average @ 1846.39
| Trends | Trends.1 | |
|---|---|---|
| 0 | Daily SMA20 | 1957.79 |
| 1 | Daily SMA50 | 1986.32 |
| 2 | Daily SMA100 | 1941.79 |
| 3 | Daily SMA200 | 1846.39 |
The previous day high was 1960.31 while the previous day low was 1924.85. The daily 38.2% Fib levels comes at 1946.76, expected to provide support. Similarly, the daily 61.8% fib level is at 1938.4, expected to provide support.
Note the levels of interest below:
- Pivot support is noted at 1935.21, 1912.3, 1899.75
- Pivot resistance is noted at 1970.67, 1983.22, 2006.13
| Levels | Levels.1 |
|---|---|
| Previous Daily High | 1960.31 |
| Previous Daily Low | 1924.85 |
| Previous Weekly High | 1973.15 |
| Previous Weekly Low | 1938.15 |
| Previous Monthly High | 2079.76 |
| Previous Monthly Low | 1932.12 |
| Daily Fibonacci 38.2% | 1946.76 |
| Daily Fibonacci 61.8% | 1938.40 |
| Daily Pivot Point S1 | 1935.21 |
| Daily Pivot Point S2 | 1912.30 |
| Daily Pivot Point S3 | 1899.75 |
| Daily Pivot Point R1 | 1970.67 |
| Daily Pivot Point R2 | 1983.22 |
| Daily Pivot Point R3 | 2006.13 |
[/s2If]
Nehcap Expert Advisor
The NEHCAP MT4 EA is high quality professional trading system geared to generate returns without using GRID or martingales. Each trade has strict risk per trade parameter. The pairs under management include EURUSD, GBPUSD, AUDCAD, AUDNZD,GBPAUD, EURAUD, EURCAD, CHFJPY and many more.
The system is trading live: LIVE ACCOUNT TRACKING
You can run it free. Apply for a free trial and track our account. Buy the system or use profit share mechanism to generate returns on your MT4.
Join Our Telegram Group


