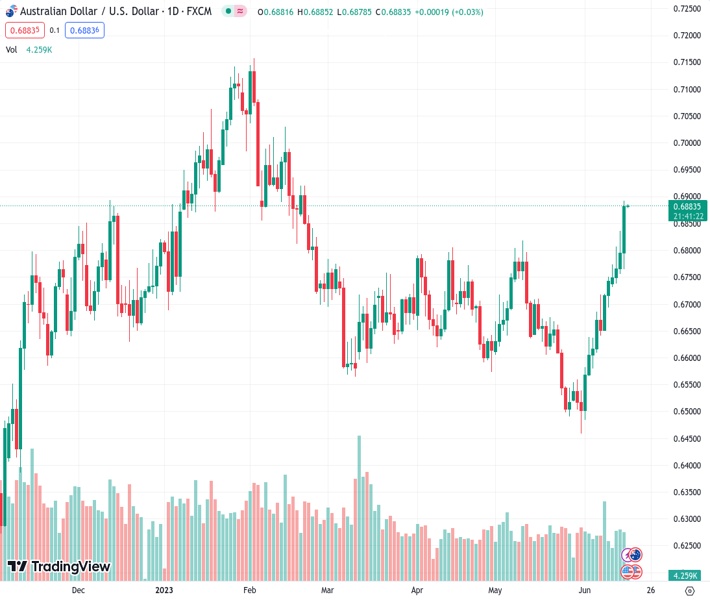
The AUDUSD at 0.68833 is now declining from its peak levels last seen in late February, as it consolidates its largest daily rise in two months.
…
This is a premium post.
[s2If !current_user_can(access_s2member_level4)]Please register for FREE REGISTER to read full post below containing analysis. In case of any error or you think you are not able to read the full post below, please email us at support#nehcap.com [lwa][/s2If] [s2If current_user_can(access_s2member_level1)]
- AUD/USD retreats from the highest levels since late February, consolidating the biggest daily jump in two months.
The pair currently trades last at 0.68833.
The previous day high was 0.6836 while the previous day low was 0.6756. The daily 38.2% Fib levels comes at 0.6805, expected to provide support. Similarly, the daily 61.8% fib level is at 0.6786, expected to provide support.
AUD/USD dribbles at the highest levels since February 21, making rounds to 0.6880-90, amid the early hours of Friday’s Asian session after rising the most since mid-April the previous day. In doing so, the Aussie pair traders portray the market’s consolidation move amid a lack of major data/events after a volatile day.
That said, the risk-barometer pair benefited from the strong Aussie jobs report versus downbeat US data, as well as the People’s Bank of China (PBoC) rate cut to post the stellar run-up.
On Thursday, Australia’s Consumer Inflation Expectations for June rose to 5.2% versus the 4.8% expected and 5.0% prior. Further, the Employment Change rallied by 75.9K in May compared to 15K market forecasts and -4.3K previous readings. Additionally, Australia’s Unemployment Rate drops to 3.6% against expectations of witnessing a no-change figure of 3.7%.
On the other hand, US Retail Sales growth marks an increase of 0.3% for May versus -0.1% expected and 0.4% previous readings while the Core readings, mean Retail Sales ex Autos, match 0.1% market forecasts for the said month, compared to 0.4% prior. Further, NY Fed Empire State Manufacturing Index jumps to 6.6 in June versus -15.1 expected and -31.8 prior whereas Philadelphia Fed Manufacturing Index drops to -13.7 for the said month from -10.4 prior and compared to -14 market forecasts. Additionally, US Industrial Production for May cools down to -0.2% against 0.1% estimated and 0.5% prior while Initial Jobless Claims reprints the upwardly revised figures of 262K for the week ended on June 09 versus 249K expected.
It should be noted that the PBoC cut its one-year interest rate for the first time in 10 months, by 10 basis points (bps), which in turn unleashed hopes of more liquidity in Australia’s biggest customer and favored the AUD/USD price.
Elsewhere, the European Central Bank’s (ECB) 25 basis points (bps) interest rate hike and clues of more such moves ahead also weighed on the US Dollar and propelled the price.
In doing so, the AUD/USD pair pays little heed to the downbeat China Retail Sales and Industrial Production while also failing to justify a nearly 67% chance of the Fed’s July rate hike.
Amid these plays, Wall Street benchmarks rallied more than 1.0% each whereas the US 10-year Treasury bond yields plummeted to 3.72%. Further, the US Dollar Index (DXY) dropped the most in three months while poking the lowest levels since May 12, to 102.15 at the latest.
Moving on, preliminary readings of the Michigan Consumer Sentiment Index (CSI) for June and five-year inflation expectations will be in the spotlight as the Fed hawks find less acceptance.
Also read: AUD/USD Forecast: Aussie not getting tired, accelerates higher
Although the overbought RSI conditions challenge the AUD/USD bulls at a multi-day high, a daily closing beyond a 3.5-month-old ascending resistance line, now support around 0.6835, keeps the Aussie pair buyers hopeful despite the latest pullback in the price.
Technical Levels: Supports and Resistances
AUDUSD currently trading at 0.6881 at the time of writing. Pair opened at 0.6796 and is trading with a change of 1.25 % .
| Overview | Overview.1 | |
|---|---|---|
| 0 | Today last price | 0.6881 |
| 1 | Today Daily Change | 0.0085 |
| 2 | Today Daily Change % | 1.2500 |
| 3 | Today daily open | 0.6796 |
The pair remains strongly bullish on the daily timeframe. It trades above its 20 SMA @ 0.6627, 50 SMA 0.6664, 100 SMA @ 0.6732 and 200 SMA @ 0.6691.
| Trends | Trends.1 | |
|---|---|---|
| 0 | Daily SMA20 | 0.6627 |
| 1 | Daily SMA50 | 0.6664 |
| 2 | Daily SMA100 | 0.6732 |
| 3 | Daily SMA200 | 0.6691 |
The previous day high was 0.6836 while the previous day low was 0.6756. The daily 38.2% Fib levels comes at 0.6805, expected to provide support. Similarly, the daily 61.8% fib level is at 0.6786, expected to provide support.
Note the levels of interest below:
- Pivot support is noted at 0.6756, 0.6716, 0.6676
- Pivot resistance is noted at 0.6836, 0.6875, 0.6915
| Levels | Levels.1 |
|---|---|
| Previous Daily High | 0.6836 |
| Previous Daily Low | 0.6756 |
| Previous Weekly High | 0.6751 |
| Previous Weekly Low | 0.6579 |
| Previous Monthly High | 0.6818 |
| Previous Monthly Low | 0.6458 |
| Daily Fibonacci 38.2% | 0.6805 |
| Daily Fibonacci 61.8% | 0.6786 |
| Daily Pivot Point S1 | 0.6756 |
| Daily Pivot Point S2 | 0.6716 |
| Daily Pivot Point S3 | 0.6676 |
| Daily Pivot Point R1 | 0.6836 |
| Daily Pivot Point R2 | 0.6875 |
| Daily Pivot Point R3 | 0.6915 |
[/s2If]
Nehcap Expert Advisor
The NEHCAP MT4 EA is high quality professional trading system geared to generate returns without using GRID or martingales. Each trade has strict risk per trade parameter. The pairs under management include EURUSD, GBPUSD, AUDCAD, AUDNZD,GBPAUD, EURAUD, EURCAD, CHFJPY and many more.
The system is trading live: LIVE ACCOUNT TRACKING
You can run it free. Apply for a free trial and track our account. Buy the system or use profit share mechanism to generate returns on your MT4.
Join Our Telegram Group


