The NZDJPY is currently stagnant at a level of 87.40, with a slight withdrawal from its previous YTD high of 87.4761. @nehcap’s opinion is that it is neutral with a slight upward trend, but care should be taken.
…
This is a premium post.
[s2If !current_user_can(access_s2member_level4)]Please register for FREE REGISTER to read full post below containing analysis. In case of any error or you think you are not able to read the full post below, please email us at support#nehcap.com [lwa][/s2If] [s2If current_user_can(access_s2member_level1)]
- NZD/JPY trades flat at 87.40, retracing slightly after reaching a new YTD high.
The pair currently trades last at 87.4761.
The previous day high was 87.0 while the previous day low was 86.07. The daily 38.2% Fib levels comes at 86.64, expected to provide support. Similarly, the daily 61.8% fib level is at 86.42, expected to provide support.
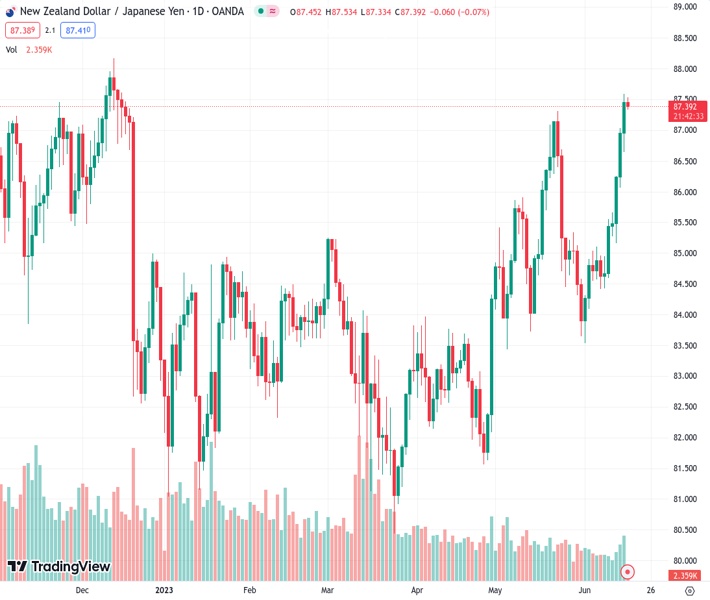
NZD/JPY retraces slightly as the Asian session begins after posting solid gains on Thursday of 0.58% and reaches a new year-to-date (YTD) high of 87.59. At the time of writing, the NZD/JPY is almost flat, exchanging hands at 87.40.
The NZD/JPY is still upward biased from a daily chart perspective, as the pair remains above the Ichimoku cloud. In addition, the cross-over of the Tenkan-Sen line above the Kijun-Sen, suggests that buyers remain in charge. But the slope of the latter for the last nine days shifted flat, suggesting some consolidation lies ahead before the NZD/JPY attacks the next resistance level at 88.17, the December 13 high.
If the NZD/JPY breaks the abovementioned price level, the next stop would be the 89.00 psychological level, as the pair gets on its way toward testing the 2015 high at 92.42. Conversely, the NZD/JPY first support would be the May 23 high at 87.31, which, once cleared, would expose the May 24 daily high turned support at 86.68. The following support levels would be the Tenkan-Sen line at 86.00 and the Kijun-Sen line at 85.56.
Given that the Ichimoku cloud suggests the NZD/JPY is upwards, oscillators like the Relative Strength Index (RSI) indicate that the pair is approaching overbought territory, but its slope aims down. The three-day Rate of Change (RoC) shows buyers are losing momentum.
Trend: Neutral-upward biased, but caution is warranted.
Technical Levels: Supports and Resistances
NZDJPY currently trading at 87.36 at the time of writing. Pair opened at 86.91 and is trading with a change of 0.52 % .
| Overview | Overview.1 | |
|---|---|---|
| 0 | Today last price | 87.36 |
| 1 | Today Daily Change | 0.45 |
| 2 | Today Daily Change % | 0.52 |
| 3 | Today daily open | 86.91 |
The pair remains strongly bullish on the daily timeframe. It trades above its 20 SMA @ 85.35, 50 SMA 84.39, 100 SMA @ 83.87 and 200 SMA @ 84.31.
| Trends | Trends.1 | |
|---|---|---|
| 0 | Daily SMA20 | 85.35 |
| 1 | Daily SMA50 | 84.39 |
| 2 | Daily SMA100 | 83.87 |
| 3 | Daily SMA200 | 84.31 |
The previous day high was 87.0 while the previous day low was 86.07. The daily 38.2% Fib levels comes at 86.64, expected to provide support. Similarly, the daily 61.8% fib level is at 86.42, expected to provide support.
Note the levels of interest below:
- Pivot support is noted at 86.32, 85.73, 85.39
- Pivot resistance is noted at 87.25, 87.59, 88.18
| Levels | Levels.1 |
|---|---|
| Previous Daily High | 87.00 |
| Previous Daily Low | 86.07 |
| Previous Weekly High | 85.55 |
| Previous Weekly Low | 84.42 |
| Previous Monthly High | 87.31 |
| Previous Monthly Low | 83.44 |
| Daily Fibonacci 38.2% | 86.64 |
| Daily Fibonacci 61.8% | 86.42 |
| Daily Pivot Point S1 | 86.32 |
| Daily Pivot Point S2 | 85.73 |
| Daily Pivot Point S3 | 85.39 |
| Daily Pivot Point R1 | 87.25 |
| Daily Pivot Point R2 | 87.59 |
| Daily Pivot Point R3 | 88.18 |
[/s2If]
Nehcap Expert Advisor
The NEHCAP MT4 EA is high quality professional trading system geared to generate returns without using GRID or martingales. Each trade has strict risk per trade parameter. The pairs under management include EURUSD, GBPUSD, AUDCAD, AUDNZD,GBPAUD, EURAUD, EURCAD, CHFJPY and many more.
The system is trading live: LIVE ACCOUNT TRACKING
You can run it free. Apply for a free trial and track our account. Buy the system or use profit share mechanism to generate returns on your MT4.
Join Our Telegram Group


