The US dollar to Mexican peso exchange rate, currently at 17.1198, has experienced slight increases of 0.15% and is currently trading at approximately 17.1320, despite the declining strength of the US dollar.
…
This is a premium post.
[s2If !current_user_can(access_s2member_level4)]Please register for FREE REGISTER to read full post below containing analysis. In case of any error or you think you are not able to read the full post below, please email us at support#nehcap.com [lwa][/s2If] [s2If current_user_can(access_s2member_level1)]
- USD/MXN registers minimal gains of 0.15%, trading around 17.1320, amidst a weakened USD.
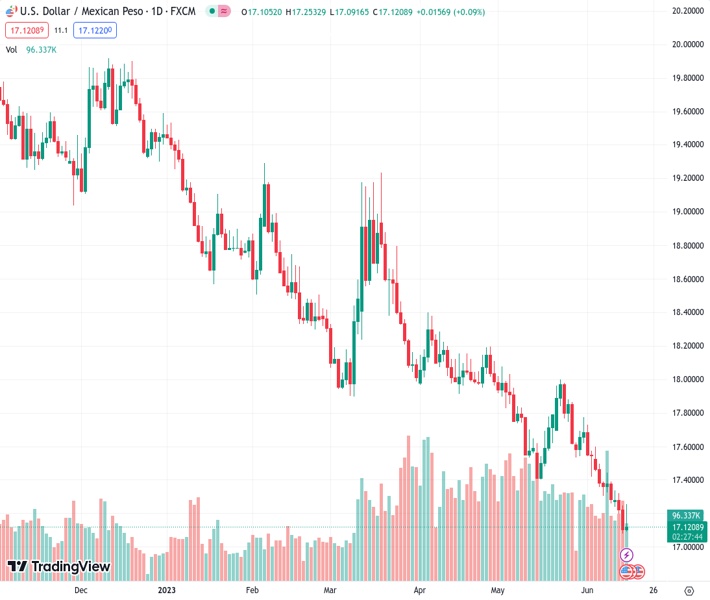
The pair currently trades last at 17.1198.
The previous day high was 17.2471 while the previous day low was 17.0789. The daily 38.2% Fib levels comes at 17.1431, expected to provide resistance. Similarly, the daily 61.8% fib level is at 17.1829, expected to provide resistance.
USD/MXN found bids around the year-to-date (YTD) low area and climbed to fresh two-day highs before reversing its path as the US Dollar (USD) weakened. Nevertheless, the USD/MXN is still registering minimal gains of 0.15%, trading at around 17.1320, after reaching a YTD low of 17.0783.
The Mexican Peso (MXN) weakened amidst a risk-on impulse, as shown by Wall Street trading with gains. Market participants were surprised by the US Federal Reserve’s (Fed) hawkish dot plots, with 12 of 18 officials lifting their dots past the 5.50% threshold and revising Fed Funds peak rates upward. Although it briefly extended the US Dollar recovery, Jerome Powell’s press conference stabilized things sending the greenback lower.
Data-wise, the US economic docket revealed a surprising expansion in Retail Sales, topping expectations, increasing 0.3% MoM in May, above estimates of a 0.1% contraction. At the same time, the US Department of Labor updated unemployment claims data for the June 10 week, growing above estimates of 249K, at 262K, the same as the prior’s week upward revised figures.
Recently revealed data, Industrial Production contracted in May -0.2% MoM, missed the forecast of 0.1% growth, while the New York and Philadelphia Fed Manufacturing Indices came mixed, with the NY rebounding unexpectedly after May’s plunge, while the Philly further deteriorated but at a slower pace.
Reacting to the data, US Treasury bond yields tumbled, a headwind for the buck. The US Dollar Index (DXY), which tracks the greenback’s value against a basket of six rivals, drops 0.77%, down at 102.209 after hitting a one-month low.
Regarding upcoming monetary policy meetings, the CME FedWatch Tool shows odds for a 25 bps rate hike in July stand at 67%. Notably, traders contradict Fed Chair Powell’s words regarding two more rate hikes, as the swaps market expects no further increases. Investors speculate the Fed would slash rates as early as January 2024, expecting six rate cuts towards December 2024, with the Federal Funds Rate (FFR) seen at 3.50%-3.75%.
The US agenda will feature Fed speakers, the US Consumer Sentiment from the University of Michigan (UoM), and American inflation expectations. On the Mexican front, next week’s Retail Sales and Bank of Mexico (Banxico) monetary policy decision are eyed by USD/MXN traders.
Despite slashing some of its losses, the USD/MXN remains downward biased as it remains below the May 16 low of 17.4038 turned resistance, seen as an inflection pivot that could shift the USD/MXN bias to neutral. That would put into play the 17.40-17.7720 area, surrounded by the 20 and 50-day Exponential Moving Averages (EMAs) at 17.4443 and 17.7238, respectively. Once those levels are cleared, USD/MXN buyers could remain hopeful the pair would challenge the 18.00 psychological level in the medium term. Otherwise, the path of least resistance is downwards, with the 17.0000 figure up next, followed by 16.50, before diving toward October 2015 low of 16.3257.
Technical Levels: Supports and Resistances
USDMXN currently trading at 17.1231 at the time of writing. Pair opened at 17.1068 and is trading with a change of 0.1 % .
| Overview | Overview.1 | |
|---|---|---|
| 0 | Today last price | 17.1231 |
| 1 | Today Daily Change | 0.0163 |
| 2 | Today Daily Change % | 0.1000 |
| 3 | Today daily open | 17.1068 |
The pair remains strongly bearish on the daily time frame. It trades below the 20 SMA @ 17.5604, 50 SMA 17.7747, 100 SMA @ 18.1337 and 200 SMA @ 18.8751.
| Trends | Trends.1 | |
|---|---|---|
| 0 | Daily SMA20 | 17.5604 |
| 1 | Daily SMA50 | 17.7747 |
| 2 | Daily SMA100 | 18.1337 |
| 3 | Daily SMA200 | 18.8751 |
The previous day high was 17.2471 while the previous day low was 17.0789. The daily 38.2% Fib levels comes at 17.1431, expected to provide resistance. Similarly, the daily 61.8% fib level is at 17.1829, expected to provide resistance.
Note the levels of interest below:
- Pivot support is noted at 17.0414, 16.976, 16.8731
- Pivot resistance is noted at 17.2097, 17.3125, 17.3779
| Levels | Levels.1 |
|---|---|
| Previous Daily High | 17.2471 |
| Previous Daily Low | 17.0789 |
| Previous Weekly High | 17.5981 |
| Previous Weekly Low | 17.2591 |
| Previous Monthly High | 18.0780 |
| Previous Monthly Low | 17.4203 |
| Daily Fibonacci 38.2% | 17.1431 |
| Daily Fibonacci 61.8% | 17.1829 |
| Daily Pivot Point S1 | 17.0414 |
| Daily Pivot Point S2 | 16.9760 |
| Daily Pivot Point S3 | 16.8731 |
| Daily Pivot Point R1 | 17.2097 |
| Daily Pivot Point R2 | 17.3125 |
| Daily Pivot Point R3 | 17.3779 |
[/s2If]
Nehcap Expert Advisor
The NEHCAP MT4 EA is high quality professional trading system geared to generate returns without using GRID or martingales. Each trade has strict risk per trade parameter. The pairs under management include EURUSD, GBPUSD, AUDCAD, AUDNZD,GBPAUD, EURAUD, EURCAD, CHFJPY and many more.
The system is trading live: LIVE ACCOUNT TRACKING
You can run it free. Apply for a free trial and track our account. Buy the system or use profit share mechanism to generate returns on your MT4.
Join Our Telegram Group


