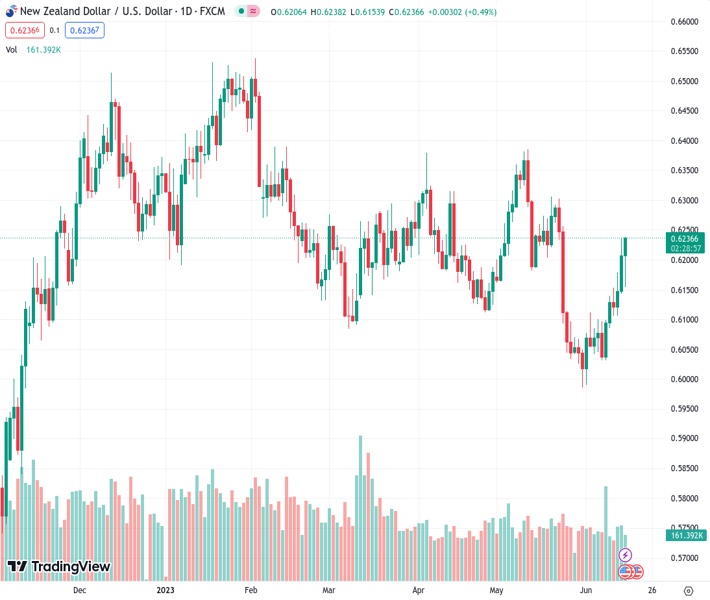
The NZDUSD currency pair rose to 0.6235 and is presently traded higher than its 20-day, 100-day, and 200-day Simple Moving Averages (SMAs).
…
This is a premium post.
[s2If !current_user_can(access_s2member_level4)]Please register for FREE REGISTER to read full post below containing analysis. In case of any error or you think you are not able to read the full post below, please email us at support#nehcap.com [lwa][/s2If] [s2If current_user_can(access_s2member_level1)]
- The NZD/USD jumped to 0.6235 and now trades above the 20,100, and 200-day SMAs.
The pair currently trades last at 0.62356.
The previous day high was 0.6236 while the previous day low was 0.6133. The daily 38.2% Fib levels comes at 0.6197, expected to provide support. Similarly, the daily 61.8% fib level is at 0.6173, expected to provide support.
In Thursday’s session, the Kiwi gained further traction to jump above the 100-day SMA as the US Dollar weakened post Jobless Claims and Retail Sales. In that sense, US bond yields are falling while US stocks are rising reflecting a positive market environment and applying further pressure on the USD. On the other hand, the NZD managed to clear losses after weak Gross Domestic Product (GDP) data from New Zealand.
The recent data from the US Census Bureau revealed that Retail Sales from May (MoM) experienced a growth of 0.3% compared to the previous reading vs the 0.1% decline expected. On the other hand, Jobless Claims for the week ending June 9 increased slightly to 262K, surpassing the predicted number of 249k but remaining at the same level as the previous week.
Despite the hawkish tone of Wednesday’s monetary policy statement from the Fed, US bond yields declined following the data as a weak labor market may reduce the pressure from Fed officials to continue to hike rates. Its worth noticing that Chair Powell stated that the labour market remains robust and that is the main engine of the US economy. That being said, the 2,5 and 10-year yields all saw declines, with the latter falling sharply to 3.72%, seeing a 1.60% contraction, and making the USD lose interest.
On the other hand, the NZD managed to shrug off weak-GDP-related losses. The report showed that the economy contracted by 0.1% QoQ in Q1, and as two consecutive contractions in quarterly figures is considered to be a technical recession.
According to the daily chart, the bulls clearly have the upperhand in the short term. The Relative Strength Index (RSI) stands above its midline with a positive slope while the Moving Average Convergence Divergence (MACD) prints rising green bars suggesting a strong bullish momentum.
In case the pair continues to move upwards, resistance levels can be found at around 0.6250, followed by the 0.6280 area and the psychological mark at 0.6300. On the other hand, supports line up at the 100-day SMA at 0.6220 and below at the 20 and 200-day SMA at 0.6150 and 0.6111, respectively.
Technical Levels: Supports and Resistances
NZDUSD currently trading at 0.6235 at the time of writing. Pair opened at 0.6206 and is trading with a change of 0.47 % .
| Overview | Overview.1 | |
|---|---|---|
| 0 | Today last price | 0.6235 |
| 1 | Today Daily Change | 0.0029 |
| 2 | Today Daily Change % | 0.4700 |
| 3 | Today daily open | 0.6206 |
The pair remains strongly bullish on the daily timeframe. It trades above its 20 SMA @ 0.6113, 50 SMA 0.6179, 100 SMA @ 0.6224 and 200 SMA @ 0.615.
| Trends | Trends.1 | |
|---|---|---|
| 0 | Daily SMA20 | 0.6113 |
| 1 | Daily SMA50 | 0.6179 |
| 2 | Daily SMA100 | 0.6224 |
| 3 | Daily SMA200 | 0.6150 |
The previous day high was 0.6236 while the previous day low was 0.6133. The daily 38.2% Fib levels comes at 0.6197, expected to provide support. Similarly, the daily 61.8% fib level is at 0.6173, expected to provide support.
Note the levels of interest below:
- Pivot support is noted at 0.6147, 0.6089, 0.6044
- Pivot resistance is noted at 0.6251, 0.6295, 0.6354
| Levels | Levels.1 |
|---|---|
| Previous Daily High | 0.6236 |
| Previous Daily Low | 0.6133 |
| Previous Weekly High | 0.6143 |
| Previous Weekly Low | 0.6026 |
| Previous Monthly High | 0.6385 |
| Previous Monthly Low | 0.5985 |
| Daily Fibonacci 38.2% | 0.6197 |
| Daily Fibonacci 61.8% | 0.6173 |
| Daily Pivot Point S1 | 0.6147 |
| Daily Pivot Point S2 | 0.6089 |
| Daily Pivot Point S3 | 0.6044 |
| Daily Pivot Point R1 | 0.6251 |
| Daily Pivot Point R2 | 0.6295 |
| Daily Pivot Point R3 | 0.6354 |
[/s2If]
Nehcap Expert Advisor
The NEHCAP MT4 EA is high quality professional trading system geared to generate returns without using GRID or martingales. Each trade has strict risk per trade parameter. The pairs under management include EURUSD, GBPUSD, AUDCAD, AUDNZD,GBPAUD, EURAUD, EURCAD, CHFJPY and many more.
The system is trading live: LIVE ACCOUNT TRACKING
You can run it free. Apply for a free trial and track our account. Buy the system or use profit share mechanism to generate returns on your MT4.
Join Our Telegram Group


