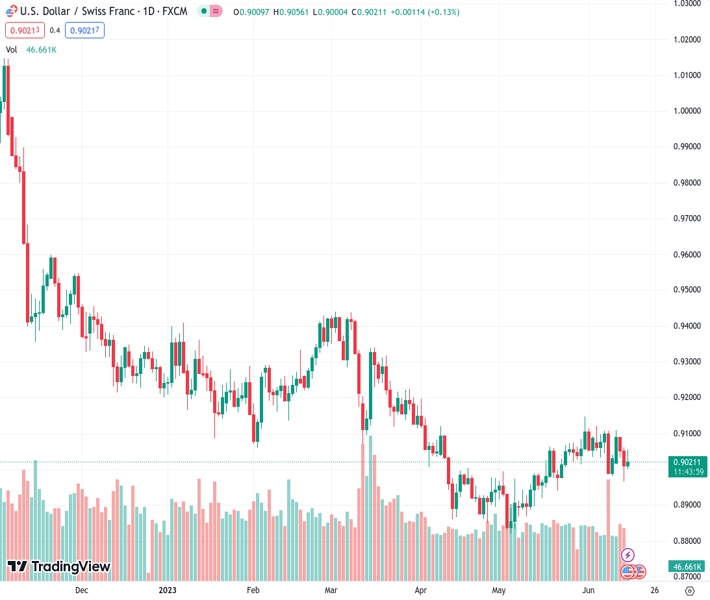
On Thursday, USDCHF saw some upward movement at 0.90216, but it did not continue further.
…
This is a premium post.
[s2If !current_user_can(access_s2member_level4)]Please register for FREE REGISTER to read full post below containing analysis. In case of any error or you think you are not able to read the full post below, please email us at support#nehcap.com [lwa][/s2If] [s2If current_user_can(access_s2member_level1)]
- USD/CHF gains some positive traction on Thursday, albeit lacks follow-through.
The pair currently trades last at 0.90216.
The previous day high was 0.906 while the previous day low was 0.8966. The daily 38.2% Fib levels comes at 0.9002, expected to provide support. Similarly, the daily 61.8% fib level is at 0.9024, expected to provide resistance.
The USD/CHF pair builds on the previous day’s late rebound from over a three-week low and gains some positive traction on Thursday, albeit struggles to capitalize on the move beyond mid-0.9000s. Spot prices retreat a few pips from the daily low and trade around the 0.9030 region, up over 0.20% during the first half of the European session.
The US Dollar (USD) trims a part of strong intraday gains and for now, seems to have stalled its recovery move from a one-month low touched on Wednesday, which, in turn, is seen acting as a headwind for the USD/CHF pair. Apart from this, a softer risk tone benefits the safe-haven Swiss Franc (CHF) and further contributes to capping the upside for the major. The market sentiment remains fragile in the wake of worries about a global economic slowdown, particularly in China. The fears were further fueled by disappointing Chinese macro data released earlier today, which tempers investors’ appetite for riskier assets and largely overshadows a move by the People’s Bank of China (PBOC) to cut rates on its medium-term loans.
The downside for the USD, meanwhile, seems cushioned on the back of the Federal Reserve’s (Fed) more hawkish outlook, signalling that borrowing costs may still need to rise by as much as 50 bps by the end of this year. In fact, the so-called “dot plot” indicated that officials now see rates peaking at 5.6% this year, higher than March’s projection of 5.1%. Furthermore, the Fed now sees slightly stronger economic growth and forecasts the economy to expand by 1% this year — up from the 0.4% rise projected in May — before rising 1.1% in 2024 and 1.8% in 2025. This triggers a fresh leg up in the US Treasury bond yields, which might continue to lend some support to the Greenback and the USD/CHF pair, at least for the time being.
Market participants now look forward to the US economic docket, featuring the release of monthly Retail Sales, Weekly Initial Jobless Claims, the Empire State Manufacturing Index, Philly Fed Manufacturing Index and Industrial Production. This, along with the US bond yields, will influence the USD price dynamics and provide some meaningful impetus to the USD/CHF pair later during the early North American session. Traders will further take cues from the broader risk sentiment to grab short-term opportunities. The aforementioned fundamental backdrop, meanwhile, now seems tilted in favour of bullish traders.
Technical Levels: Supports and Resistances
USDCHF currently trading at 0.9032 at the time of writing. Pair opened at 0.9012 and is trading with a change of 0.22 % .
| Overview | Overview.1 | |
|---|---|---|
| 0 | Today last price | 0.9032 |
| 1 | Today Daily Change | 0.0020 |
| 2 | Today Daily Change % | 0.2200 |
| 3 | Today daily open | 0.9012 |
The pair is trading below its 20 Daily moving average @ 0.9048, above its 50 Daily moving average @ 0.8987 , below its 100 Daily moving average @ 0.9115 and below its 200 Daily moving average @ 0.9347
| Trends | Trends.1 | |
|---|---|---|
| 0 | Daily SMA20 | 0.9048 |
| 1 | Daily SMA50 | 0.8987 |
| 2 | Daily SMA100 | 0.9115 |
| 3 | Daily SMA200 | 0.9347 |
The previous day high was 0.906 while the previous day low was 0.8966. The daily 38.2% Fib levels comes at 0.9002, expected to provide support. Similarly, the daily 61.8% fib level is at 0.9024, expected to provide resistance.
Note the levels of interest below:
- Pivot support is noted at 0.8965, 0.8918, 0.887
- Pivot resistance is noted at 0.906, 0.9108, 0.9155
| Levels | Levels.1 |
|---|---|
| Previous Daily High | 0.9060 |
| Previous Daily Low | 0.8966 |
| Previous Weekly High | 0.9120 |
| Previous Weekly Low | 0.8984 |
| Previous Monthly High | 0.9148 |
| Previous Monthly Low | 0.8820 |
| Daily Fibonacci 38.2% | 0.9002 |
| Daily Fibonacci 61.8% | 0.9024 |
| Daily Pivot Point S1 | 0.8965 |
| Daily Pivot Point S2 | 0.8918 |
| Daily Pivot Point S3 | 0.8870 |
| Daily Pivot Point R1 | 0.9060 |
| Daily Pivot Point R2 | 0.9108 |
| Daily Pivot Point R3 | 0.9155 |
[/s2If]
Nehcap Expert Advisor
The NEHCAP MT4 EA is high quality professional trading system geared to generate returns without using GRID or martingales. Each trade has strict risk per trade parameter. The pairs under management include EURUSD, GBPUSD, AUDCAD, AUDNZD,GBPAUD, EURAUD, EURCAD, CHFJPY and many more.
The system is trading live: LIVE ACCOUNT TRACKING
You can run it free. Apply for a free trial and track our account. Buy the system or use profit share mechanism to generate returns on your MT4.
Join Our Telegram Group
")


