WTI plunges to $66.80 due to the worldwide economic slowdown and lowered predictions for oil prices.
…
This is a premium post.
[s2If !current_user_can(access_s2member_level4)]Please register for FREE REGISTER to read full post below containing analysis. In case of any error or you think you are not able to read the full post below, please email us at support#nehcap.com [lwa][/s2If] [s2If current_user_can(access_s2member_level1)]
- WTI nosedives to $66.80, influenced by global economic deceleration and reduced oil price forecasts.
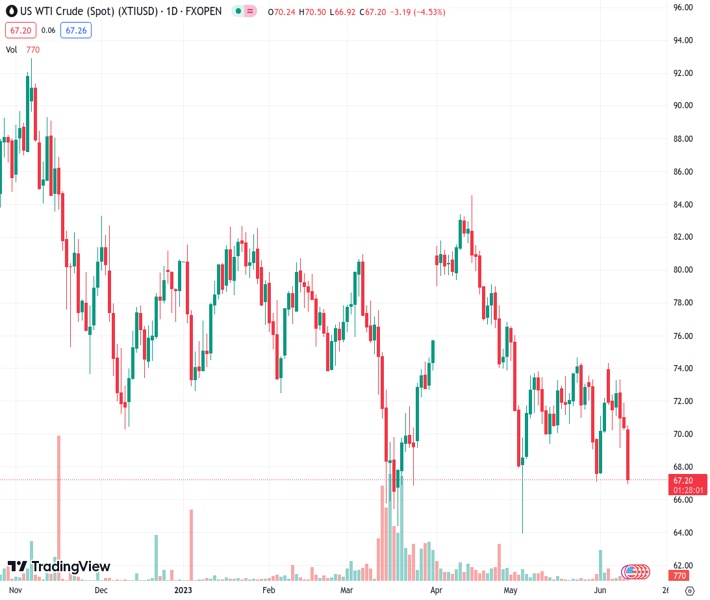
The pair currently trades last at 67.2.
The previous day high was 71.9 while the previous day low was 70.24. The daily 38.2% Fib levels comes at 70.88, expected to provide resistance. Similarly, the daily 61.8% fib level is at 71.27, expected to provide resistance.
Western Texas Intermediate (WTI), the US crude oil benchmark, plunges sharply due to see an ongoing global economic deceleration, as well as analysts slashing oil price forecasts ahead of the release of inflation in the United States (US), and the Federal Reserve (Fed) meeting on Wednesday. WTI is trading at $66.80, plummeting almost 5% after hitting a daily high of $70.22.
Wall Street is trading with solid gains at the start of the week. Expectations for an increase of supplies from Russia and Iran triggered a forecast revision from Goldman Sachs, which downward revised WTI from $89 a barrel to $81 by the year’s end.
Weaker than expected, last week’s data from China, showing that exports contracted above estimates showed a grim outlook for global demand amongst developed markets. Alongside speculations that the People’s Bank of China (PboC) will reduce rates to stimulate the economy triggered Monday’s drop despite OPEC+’s efforts to cushion oil prices.
In the meantime, the US will reveal the Consumer Price Index (CPI) for May, which is expected to show the impact of 500 basis points (bps) of rate hikes by the Fed. Upward surprises on the data would likely trigger a reaction by the Fed, as Jerome Powell and Co would reveal its decision on Wednesday at around 18:00 GMT.
Further Fed increases would boost the US Dollar (USD), a headwind for dollar-denominated assets. However, WTI’s fall was capped by the Saudis, which pledged to cut oil production in July.
The US crude oil benchmark fell below May’s low of $67.08, opening the door for further losses, beneath the $67.00 mark, putting into play March’s 20 swing low at $64.41, ahead of challenging the year-to-date (YTD) low of $63.61. On the upside, WTI’s first resistance would be the 2022 low of $70.10, followed by the 20-day Exponential Moving Average (EMA) at $71.23. A breach of the latter will expose the 50-day EMA at $72.97.
The Relative Strength Index (RSI) and the three-day Rate of Change (RoC) portray sellers gathering momentum, so more downside is expected.
Technical Levels: Supports and Resistances
XTIUSD currently trading at 67.2 at the time of writing. Pair opened at 70.46 and is trading with a change of -4.63 % .
| Overview | Overview.1 | |
|---|---|---|
| 0 | Today last price | 67.20 |
| 1 | Today Daily Change | -3.26 |
| 2 | Today Daily Change % | -4.63 |
| 3 | Today daily open | 70.46 |
The pair remains strongly bearish on the daily time frame. It trades below the 20 SMA @ 71.66, 50 SMA 74.67, 100 SMA @ 75.28 and 200 SMA @ 78.58.
| Trends | Trends.1 | |
|---|---|---|
| 0 | Daily SMA20 | 71.66 |
| 1 | Daily SMA50 | 74.67 |
| 2 | Daily SMA100 | 75.28 |
| 3 | Daily SMA200 | 78.58 |
The previous day high was 71.9 while the previous day low was 70.24. The daily 38.2% Fib levels comes at 70.88, expected to provide resistance. Similarly, the daily 61.8% fib level is at 71.27, expected to provide resistance.
Note the levels of interest below:
- Pivot support is noted at 69.83, 69.2, 68.17
- Pivot resistance is noted at 71.5, 72.53, 73.16
| Levels | Levels.1 |
|---|---|
| Previous Daily High | 71.90 |
| Previous Daily Low | 70.24 |
| Previous Weekly High | 74.36 |
| Previous Weekly Low | 69.17 |
| Previous Monthly High | 76.61 |
| Previous Monthly Low | 64.31 |
| Daily Fibonacci 38.2% | 70.88 |
| Daily Fibonacci 61.8% | 71.27 |
| Daily Pivot Point S1 | 69.83 |
| Daily Pivot Point S2 | 69.20 |
| Daily Pivot Point S3 | 68.17 |
| Daily Pivot Point R1 | 71.50 |
| Daily Pivot Point R2 | 72.53 |
| Daily Pivot Point R3 | 73.16 |
[/s2If]
Nehcap Expert Advisor
The NEHCAP MT4 EA is high quality professional trading system geared to generate returns without using GRID or martingales. Each trade has strict risk per trade parameter. The pairs under management include EURUSD, GBPUSD, AUDCAD, AUDNZD,GBPAUD, EURAUD, EURCAD, CHFJPY and many more.
The system is trading live: LIVE ACCOUNT TRACKING
You can run it free. Apply for a free trial and track our account. Buy the system or use profit share mechanism to generate returns on your MT4.
Join Our Telegram Group


