After experiencing four consecutive days of declines, the USDCAD rose to its highest point of the day at 1.3384.
…
This is a premium post.
[s2If !current_user_can(access_s2member_level4)]Please register for FREE REGISTER to read full post below containing analysis. In case of any error or you think you are not able to read the full post below, please email us at support#nehcap.com [lwa][/s2If] [s2If current_user_can(access_s2member_level1)]
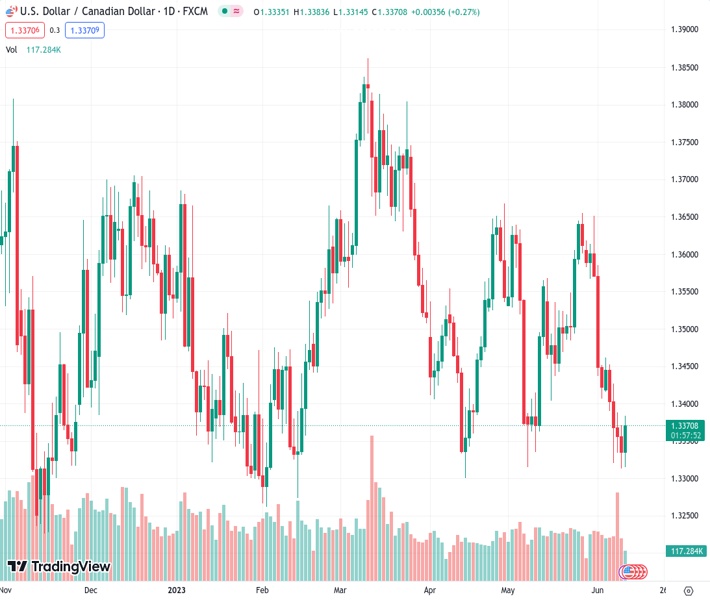
- USD/CAD jumped to a daily high of 1.3384 following four days of losses.
The pair currently trades last at 1.33722.
The previous day high was 1.3371 while the previous day low was 1.3313. The daily 38.2% Fib levels comes at 1.3335, expected to provide support. Similarly, the daily 61.8% fib level is at 1.3349, expected to provide support.
During Monday’s session, the USD/CAD cut a four-day losing streak jumping to a daily high of 1.3384 as the US Dollar held its footing ahead of an eventful week. On the other hand, the Lonnie seems to be suffering from the plunge in Oil prices which have seen losses of more than 3% on the day.
Markets seem to be awaiting the upcoming release of the US Consumer Price Index (CPI) data for May to define direction. It is anticipated that the headline figure will show a slowdown to a year-on-year (YoY) rate of 4.1%, while the Core measure is expected to decline from the previous 5.5% YoY to 5.3%.
In addition, the CME FedWatch Tool, currently suggests a 25% chance of an interest rate hike for the upcoming Wednesday’s Federal Reserve (Fed) decision. Moreover, rate cuts are no longer anticipated by the end of the year, so market participants will keep an eye on Fed Chair Powell’s presser on Wednesday looking for clues regarding forward guidance
On the Canadian side, the CAD bulls seem to have taken a step back and are consolidating gains from last week’s Bank of Canada (BoC) surprising 25 basis point (bps) hike. Moreover, the Loonie seems to be facing further weakness amid Oil’s heavy losses as the WTI (Western Texas Intermediate) is down by 3.60% on the day, trading at the $67.45 level.
According to the daily chart, the USD/CAD shows a neutral to bearish perspective for the short term. Despite indicators having gained some traction, they are still operating in negative territory. The Relative Strength Index (RSI) sits below its midline but exhibits a positive slope. while, the Moving Average Convergence Divergence (MACD) printed a decreasing red bar, indicating diminishing selling momentum.
The 1.3350 zone level is key for USD/CAD to maintain its upside bias. If breached, the price could see a steeper decline towards the 1.3310 area and towards the multi-month low at 1.3300. Furthermore, upcoming resistance for USD/CAD is seen at the zone at 1.3380 level, followed by the psychological mark at 1.3400 and the 1.3450 area.
Technical Levels: Supports and Resistances
USDCAD currently trading at 1.3374 at the time of writing. Pair opened at 1.3338 and is trading with a change of 0.27 % .
| Overview | Overview.1 | |
|---|---|---|
| 0 | Today last price | 1.3374 |
| 1 | Today Daily Change | 0.0036 |
| 2 | Today Daily Change % | 0.2700 |
| 3 | Today daily open | 1.3338 |
The pair remains strongly bearish on the daily time frame. It trades below the 20 SMA @ 1.3492, 50 SMA 1.3488, 100 SMA @ 1.3515 and 200 SMA @ 1.3514.
| Trends | Trends.1 | |
|---|---|---|
| 0 | Daily SMA20 | 1.3492 |
| 1 | Daily SMA50 | 1.3488 |
| 2 | Daily SMA100 | 1.3515 |
| 3 | Daily SMA200 | 1.3514 |
The previous day high was 1.3371 while the previous day low was 1.3313. The daily 38.2% Fib levels comes at 1.3335, expected to provide support. Similarly, the daily 61.8% fib level is at 1.3349, expected to provide support.
Note the levels of interest below:
- Pivot support is noted at 1.331, 1.3283, 1.3252
- Pivot resistance is noted at 1.3368, 1.3399, 1.3426
| Levels | Levels.1 |
|---|---|
| Previous Daily High | 1.3371 |
| Previous Daily Low | 1.3313 |
| Previous Weekly High | 1.3462 |
| Previous Weekly Low | 1.3313 |
| Previous Monthly High | 1.3655 |
| Previous Monthly Low | 1.3315 |
| Daily Fibonacci 38.2% | 1.3335 |
| Daily Fibonacci 61.8% | 1.3349 |
| Daily Pivot Point S1 | 1.3310 |
| Daily Pivot Point S2 | 1.3283 |
| Daily Pivot Point S3 | 1.3252 |
| Daily Pivot Point R1 | 1.3368 |
| Daily Pivot Point R2 | 1.3399 |
| Daily Pivot Point R3 | 1.3426 |
[/s2If]
Nehcap Expert Advisor
The NEHCAP MT4 EA is high quality professional trading system geared to generate returns without using GRID or martingales. Each trade has strict risk per trade parameter. The pairs under management include EURUSD, GBPUSD, AUDCAD, AUDNZD,GBPAUD, EURAUD, EURCAD, CHFJPY and many more.
The system is trading live: LIVE ACCOUNT TRACKING
You can run it free. Apply for a free trial and track our account. Buy the system or use profit share mechanism to generate returns on your MT4.
Join Our Telegram Group


