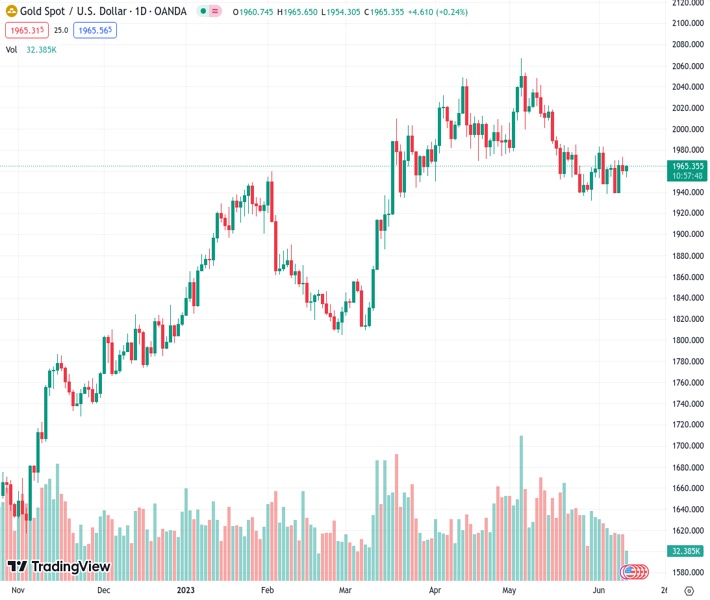
#XAUUSD @ 1,965.25 Gold price is approaching the $1,970.00 resistance as the USD Index has resumed its downside journey. (Pivot Orderbook analysis)
…
This is a premium post.
[s2If !current_user_can(access_s2member_level4)]Please register for FREE REGISTER to read full post below containing analysis. In case of any error or you think you are not able to read the full post below, please email us at support#nehcap.com [lwa][/s2If] [s2If current_user_can(access_s2member_level1)]
- Gold price is approaching the $1,970.00 resistance as the USD Index has resumed its downside journey.
- S&P500 futures have posted stellar gains as investors have underpinned the risk-appetite theme.
- More interest rate hikes by the Fed are less certain as tight lending conditions by US commercial banks have trimmed liquidity.
The pair currently trades last at 1965.25.
The previous day high was 1973.15 while the previous day low was 1956.65. The daily 38.2% Fib levels comes at 1962.95, expected to provide support. Similarly, the daily 61.8% fib level is at 1966.85, expected to provide resistance.
Gold price (XAU/USD) is marching towards the crucial resistance of $1,970.00 after a strong recovery from $1,956.00 in the London session. The precious metal has attracted significant bids after a sell-off in the US Dollar Index (DXY).
S&P500 futures have posted stellar gains in Europe as investors have underpinned the risk-appetite theme. US equities are becoming the talk of the town as investors are hoping that the Federal Reserve (Fed) will choose a steady interest rate policy.
Earlier, Fed chair Jerome Powell announced that more interest rate hikes are less certain as tight lending conditions by United States commercial banks are barricading inflationary pressures. And, now easing labor market conditions is a cherry on the cake, which is providing the Fed the luxury of keeping interest rates steady.
Meanwhile, the US economic activities are also demonstrating a poor show as manufacturing activities are consistently contracting and services activities are barely showing expansion.
The US Dollar Index is looking to resume its downside journey amid the inability of sustaining above the intermediate support around 103.30. Contrary to that, the US Treasury yields are choppy. The returns generated on 10-year US Treasury bonds are holding above 3.75%.
Gold price is consolidating in a narrow range of $1,954-1,970 on a two-hour scale, which indicates a volatility contraction followed by wider ticks and heavy volume. On a broader note, the upside of the Gold price is restricted from May 18 high around $1,986.00 while the downside is limited to May 26 low around $1,936.77.
A straight 50-period Exponential Moving Average (EMA) at $1,959.70 indicates that the overall trend is non-directional.
Also, the Relative Strength Index (RSI) (14) is oscillating in the 40.00-60.00 range, which conveys that investors are awaiting a potential trigger.
Technical Levels: Supports and Resistances
XAUUSD currently trading at 1964.97 at the time of writing. Pair opened at 1961.24 and is trading with a change of 0.19 % .
| Overview | Overview.1 | |
|---|---|---|
| 0 | Today last price | 1964.97 |
| 1 | Today Daily Change | 3.73 |
| 2 | Today Daily Change % | 0.19 |
| 3 | Today daily open | 1961.24 |
The pair is trading above its 20 Daily moving average @ 1964.94, below its 50 Daily moving average @ 1990.17 , above its 100 Daily moving average @ 1941.2 and above its 200 Daily moving average @ 1841.6
| Trends | Trends.1 | |
|---|---|---|
| 0 | Daily SMA20 | 1964.94 |
| 1 | Daily SMA50 | 1990.17 |
| 2 | Daily SMA100 | 1941.20 |
| 3 | Daily SMA200 | 1841.60 |
The previous day high was 1973.15 while the previous day low was 1956.65. The daily 38.2% Fib levels comes at 1962.95, expected to provide support. Similarly, the daily 61.8% fib level is at 1966.85, expected to provide resistance.
Note the levels of interest below:
- Pivot support is noted at 1954.21, 1947.18, 1937.71
- Pivot resistance is noted at 1970.71, 1980.18, 1987.21
| Levels | Levels.1 |
|---|---|
| Previous Daily High | 1973.15 |
| Previous Daily Low | 1956.65 |
| Previous Weekly High | 1973.15 |
| Previous Weekly Low | 1938.15 |
| Previous Monthly High | 2079.76 |
| Previous Monthly Low | 1932.12 |
| Daily Fibonacci 38.2% | 1962.95 |
| Daily Fibonacci 61.8% | 1966.85 |
| Daily Pivot Point S1 | 1954.21 |
| Daily Pivot Point S2 | 1947.18 |
| Daily Pivot Point S3 | 1937.71 |
| Daily Pivot Point R1 | 1970.71 |
| Daily Pivot Point R2 | 1980.18 |
| Daily Pivot Point R3 | 1987.21 |
[/s2If]
Nehcap Expert Advisor
The NEHCAP MT4 EA is high quality professional trading system geared to generate returns without using GRID or martingales. Each trade has strict risk per trade parameter. The pairs under management include EURUSD, GBPUSD, AUDCAD, AUDNZD,GBPAUD, EURAUD, EURCAD, CHFJPY and many more.
The system is trading live: LIVE ACCOUNT TRACKING
You can run it free. Apply for a free trial and track our account. Buy the system or use profit share mechanism to generate returns on your MT4.
Join Our Telegram Group
")


