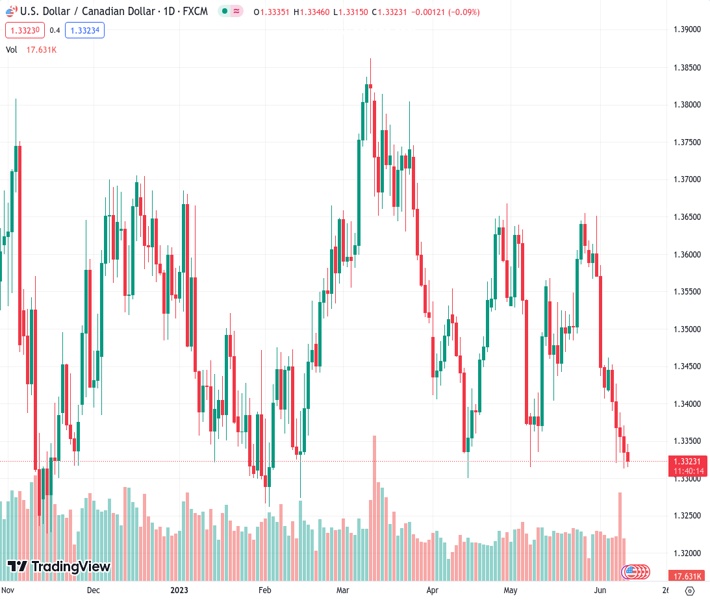
#USDCAD @ 1.33231 turns lower for the fifth straight day and is pressured by renewed USD selling. (Pivot Orderbook analysis)
…
This is a premium post.
[s2If !current_user_can(access_s2member_level4)]Please register for FREE REGISTER to read full post below containing analysis. In case of any error or you think you are not able to read the full post below, please email us at support#nehcap.com [lwa][/s2If] [s2If current_user_can(access_s2member_level1)]
- USD/CAD turns lower for the fifth straight day and is pressured by renewed USD selling.
- Bearish Crude Oil prices could undermine the Loonie and help limit losses for the major.
- Traders also seem reluctant ahead of the US CPI on Tuesday and the FOMC on Wednesday.
The pair currently trades last at 1.33231.
The previous day high was 1.3371 while the previous day low was 1.3313. The daily 38.2% Fib levels comes at 1.3335, expected to provide resistance. Similarly, the daily 61.8% fib level is at 1.3349, expected to provide resistance.
The USD/CAD pair meets with a fresh supply following an early uptick to the 1.3355-1.3360 region on Monday and turns lower for the fifth successive day – also marking the eighth day of a negative move in the previous nine. Spot prices extend the intraday descent through the first half of the European session and drop to the 1.3320-1.3315 region in the last hour, closer to over a one-month low touched on Friday.
A positive tone around the equity markets fails to assist the safe-haven US Dollar (USD) to capitalize on Friday’s bounce from its lowest level since May 24 and attracts fresh sellers on the first day of a new week. Apart from this, the Bank of Canada’s (BoC) surprise 25 bps rate hike last week continues to underpin the Canadian Dollar (CAD) and exerts some downward pressure on the USD/CAD pair. That said, a combination of factors might hold back traders from placing fresh bearish bets around the major and help limit losses for the major, at least for the time being.
The uncertainty over the Federal Reserve’s (Fed) rate hike path, along with a modest uptick in the US Treasury bond yields, could act as a tailwind for the Greenback. It is worth recalling that the recent dovish rhetoric by a slew of influential Fed officials fueled speculations that the US central bank will skip raising interest rates at the end of a two-day meeting on Wednesday. The markets, however, are still pricing in the possibility of another 25 bps lift-off at the July FOMC meeting on the back of expectations that the fight against stubbornly high inflation is not over yet.
Furthermore, worries that a global economic slowdown will dent fuel demand continue to weigh heavily on Crude Oil prices, which could undermine the commodity-liked Loonie and lend some support to the USD/CAD pair. Traders might also prefer to wait on the sidelines ahead of the latest US consumer inflation figures, due for release on Tuesday, and the highly-anticipated FOMC policy decision on Wednesday. This, in turn, will play a key role in driving the USD demand and help traders to determine the next leg of a directional move for the major.
Technical Levels: Supports and Resistances
USDCAD currently trading at 1.3317 at the time of writing. Pair opened at 1.3338 and is trading with a change of -0.16 % .
| Overview | Overview.1 | |
|---|---|---|
| 0 | Today last price | 1.3317 |
| 1 | Today Daily Change | -0.0021 |
| 2 | Today Daily Change % | -0.1600 |
| 3 | Today daily open | 1.3338 |
The pair remains strongly bearish on the daily time frame. It trades below the 20 SMA @ 1.3492, 50 SMA 1.3488, 100 SMA @ 1.3515 and 200 SMA @ 1.3514.
| Trends | Trends.1 | |
|---|---|---|
| 0 | Daily SMA20 | 1.3492 |
| 1 | Daily SMA50 | 1.3488 |
| 2 | Daily SMA100 | 1.3515 |
| 3 | Daily SMA200 | 1.3514 |
The previous day high was 1.3371 while the previous day low was 1.3313. The daily 38.2% Fib levels comes at 1.3335, expected to provide resistance. Similarly, the daily 61.8% fib level is at 1.3349, expected to provide resistance.
Note the levels of interest below:
- Pivot support is noted at 1.331, 1.3283, 1.3252
- Pivot resistance is noted at 1.3368, 1.3399, 1.3426
| Levels | Levels.1 |
|---|---|
| Previous Daily High | 1.3371 |
| Previous Daily Low | 1.3313 |
| Previous Weekly High | 1.3462 |
| Previous Weekly Low | 1.3313 |
| Previous Monthly High | 1.3655 |
| Previous Monthly Low | 1.3315 |
| Daily Fibonacci 38.2% | 1.3335 |
| Daily Fibonacci 61.8% | 1.3349 |
| Daily Pivot Point S1 | 1.3310 |
| Daily Pivot Point S2 | 1.3283 |
| Daily Pivot Point S3 | 1.3252 |
| Daily Pivot Point R1 | 1.3368 |
| Daily Pivot Point R2 | 1.3399 |
| Daily Pivot Point R3 | 1.3426 |
[/s2If]
Nehcap Expert Advisor
The NEHCAP MT4 EA is high quality professional trading system geared to generate returns without using GRID or martingales. Each trade has strict risk per trade parameter. The pairs under management include EURUSD, GBPUSD, AUDCAD, AUDNZD,GBPAUD, EURAUD, EURCAD, CHFJPY and many more.
The system is trading live: LIVE ACCOUNT TRACKING
You can run it free. Apply for a free trial and track our account. Buy the system or use profit share mechanism to generate returns on your MT4.
Join Our Telegram Group
")


