#XAUUSD @ 1965.05 Gold price reverses a modest intraday dip, though the upside remains capped. (Pivot Orderbook analysis)
…
This is a premium post.
[s2If !current_user_can(access_s2member_level4)]Please register for FREE REGISTER to read full post below containing analysis. In case of any error or you think you are not able to read the full post below, please email us at support#nehcap.com [lwa][/s2If] [s2If current_user_can(access_s2member_level1)]
- Gold price reverses a modest intraday dip, though the upside remains capped.
- The US Dollar struggles to preserve its gains and lends support to the XAU/USD.
- Traders keenly await the US CPI report and key central bank event risks this week.
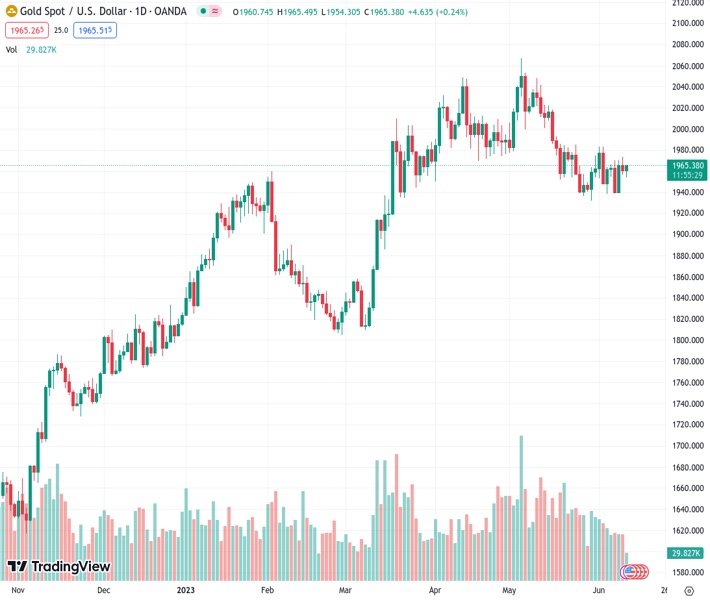
The pair currently trades last at 1965.05.
The previous day high was 1973.15 while the previous day low was 1956.65. The daily 38.2% Fib levels comes at 1962.95, expected to provide support. Similarly, the daily 61.8% fib level is at 1966.85, expected to provide resistance.
Gold price attracts some dip-buying near the $1,954 region on the first day of a new week and climbs to the top end of its daily trading range during the early European session. The XAU/USD currently trades around the $1,960 level, nearly unchanged for the day, and for now, seems to have stalled its retracement slide from a one-week high touched on Friday.
Despite a modest uptick in the US Treasury bond yields, the US Dollar (USD) struggles to preserve its modest intraday gains and turns out to be a key factor lending some support to Gold price. The downside for the USD, however, seems cushioned, at least for the time being, as traders seem reluctant in the wake of the uncertainty over the Federal Reserve’s (Fed) rate hike path. It is worth recalling that a slew of Fed officials recently fueled speculations about an imminent pause in the central bank’s year-long policy tightening cycle. That said, the markets are still pricing in the possibility of another 25 bps lift-off at the next Federal Open Market Committee (FOMC) policy meeting in July.
The bets were lifted following surprise rate hikes by the Reserve Bank of Australia (RBA) and the Bank of Canada (BoC) last week, which suggested that the fight against inflation is not over yet. This, in turn, might hold back traders from placing aggressive bullish bets around Gold price ahead of this week’s release of the latest consumer inflation figures from the United States (US), due on Tuesday. A stronger US Consumer Price Index (CPI) will support prospects for further policy tightening by the Fed, which is scheduled to announce its policy decision at the end of the highly-anticipated two-day meeting on Wednesday, and should provide a fresh impetus to the XAU/USD.
In the meantime, firming expectations for additional interest rate hikes by the European Central Bank (ECB), due to announce its decision on Thursday, and the Bank of England (BoE) might contribute to capping the non-yielding Gold price. Investors this week will further take cues from the Bank of Japan (BoJ) meeting on Friday. This makes it prudent to wait for strong follow-through buying before positioning for an extension of the recent bounce from the 100-day Simple Moving Average (SMA) support, currently near the $1,941 area, held over the past two weeks or so.
Technical Levels: Supports and Resistances
XAUUSD currently trading at 1960.15 at the time of writing. Pair opened at 1961.24 and is trading with a change of -0.06 % .
| Overview | Overview.1 | |
|---|---|---|
| 0 | Today last price | 1960.15 |
| 1 | Today Daily Change | -1.09 |
| 2 | Today Daily Change % | -0.06 |
| 3 | Today daily open | 1961.24 |
The pair is trading below its 20 Daily moving average @ 1964.94, below its 50 Daily moving average @ 1990.17 , above its 100 Daily moving average @ 1941.2 and above its 200 Daily moving average @ 1841.6
| Trends | Trends.1 | |
|---|---|---|
| 0 | Daily SMA20 | 1964.94 |
| 1 | Daily SMA50 | 1990.17 |
| 2 | Daily SMA100 | 1941.20 |
| 3 | Daily SMA200 | 1841.60 |
The previous day high was 1973.15 while the previous day low was 1956.65. The daily 38.2% Fib levels comes at 1962.95, expected to provide support. Similarly, the daily 61.8% fib level is at 1966.85, expected to provide resistance.
Note the levels of interest below:
- Pivot support is noted at 1954.21, 1947.18, 1937.71
- Pivot resistance is noted at 1970.71, 1980.18, 1987.21
| Levels | Levels.1 |
|---|---|
| Previous Daily High | 1973.15 |
| Previous Daily Low | 1956.65 |
| Previous Weekly High | 1973.15 |
| Previous Weekly Low | 1938.15 |
| Previous Monthly High | 2079.76 |
| Previous Monthly Low | 1932.12 |
| Daily Fibonacci 38.2% | 1962.95 |
| Daily Fibonacci 61.8% | 1966.85 |
| Daily Pivot Point S1 | 1954.21 |
| Daily Pivot Point S2 | 1947.18 |
| Daily Pivot Point S3 | 1937.71 |
| Daily Pivot Point R1 | 1970.71 |
| Daily Pivot Point R2 | 1980.18 |
| Daily Pivot Point R3 | 1987.21 |
[/s2If]
Nehcap Expert Advisor
The NEHCAP MT4 EA is high quality professional trading system geared to generate returns without using GRID or martingales. Each trade has strict risk per trade parameter. The pairs under management include EURUSD, GBPUSD, AUDCAD, AUDNZD,GBPAUD, EURAUD, EURCAD, CHFJPY and many more.
The system is trading live: LIVE ACCOUNT TRACKING
You can run it free. Apply for a free trial and track our account. Buy the system or use profit share mechanism to generate returns on your MT4.
Join Our Telegram Group
")


