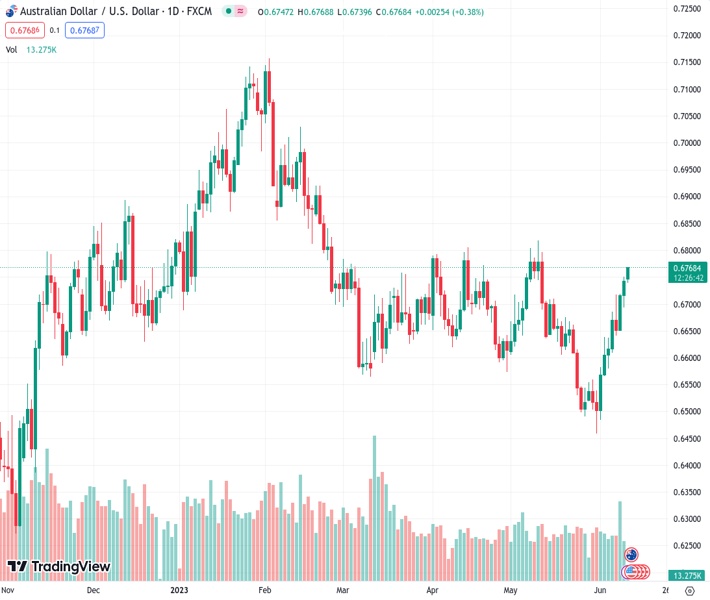
#AUDUSD @ 0.67680 gains positive traction for the third straight day and climbs to a fresh one-month high. (Pivot Orderbook analysis)
…
This is a premium post.
[s2If !current_user_can(access_s2member_level4)]Please register for FREE REGISTER to read full post below containing analysis. In case of any error or you think you are not able to read the full post below, please email us at support#nehcap.com [lwa][/s2If] [s2If current_user_can(access_s2member_level1)]
- AUD/USD gains positive traction for the third straight day and climbs to a fresh one-month high.
- The RBA’s hawkish outlook and a positive risk tone push spot prices beyond the 100-day SMA.
- The Fed rate hike uncertainty and economic woes might cap any meaningful upside for the pair.
- Traders might also prefer to wait ahead of the US CPI on Tuesday and the FOMC on Wednesday.
The pair currently trades last at 0.67680.
The previous day high was 0.6751 while the previous day low was 0.6693. The daily 38.2% Fib levels comes at 0.6729, expected to provide support. Similarly, the daily 61.8% fib level is at 0.6715, expected to provide support.
The AUD/USD pair scales higher for the third successive day – also marking the seventh day of a positive move in the previous eight – and climbs to a fresh one-month high during the early European session on Monday. The pair is currently placed around the 0.6760-0.6765 region, up over 0.25% for the day, and seems to have confirmed a fresh bullish breakout through a technically significant 100-day Simple Moving Average (SMA).
The Australian Dollar (AUD) continues to draw support from the Reserve Bank of Australia’s (RBA) surprise 25 bps rate hike last week and a more hawkish policy statement. Adding to this, a generally positive tone around the equity markets act as a headwind for the safe-haven US Dollar (USD) and further benefits the risk-sensitive Aussie. That said, a modest uptick in the US Treasury bond yields should lend support to the USD losses and keep a lid on the AUD/USD pair.
Furthermore, worries about a global economic slowdown, particularly in China, could contribute to limiting the downside for the Greenback and capping gains for the China-proxy AUD. Traders might also refrain from placing aggressive bets and prefer to wait for this week’s release of the crucial US consumer inflation data on Tuesday. This will be followed by the highly-anticipated FOMC decision on Wednesday, which will provide a fresh impetus to the AUD/USD pair.
The aforementioned fundamental backdrop makes it prudent to wait for sustained strength and acceptance above the 0.6800 mark before positioning for any further appreciating move. The AUD/USD pair might then accelerate the momentum towards the next relevant hurdle near the 0.6865-0.6870 horizontal zone en route to the 0.6900 round figure. Bulls might eventually aim to reclaim the 0.7000 psychological mark with some intermediate hurdle near the 0.6970-0.6975 area.
On the flip side, the 0.6735 area (100-day SMA), now seems to protect the immediate downside. This is followed by the 0.6700 mark and the very important 200-day SMA, currently around the 0.6680 region. Failure to defend the said support levels might prompt some technical selling and make the AUD/USD pair vulnerable. The subsequent downfall has the potential to drag spot prices further below the 0.6645 support, towards retesting the 0.6600 round-figure mark.
Technical Levels: Supports and Resistances
AUDUSD currently trading at 0.6767 at the time of writing. Pair opened at 0.6742 and is trading with a change of 0.37 % .
| Overview | Overview.1 | |
|---|---|---|
| 0 | Today last price | 0.6767 |
| 1 | Today Daily Change | 0.0025 |
| 2 | Today Daily Change % | 0.3700 |
| 3 | Today daily open | 0.6742 |
The pair remains strongly bullish on the daily timeframe. It trades above its 20 SMA @ 0.6613, 50 SMA 0.6663, 100 SMA @ 0.6741 and 200 SMA @ 0.6691.
| Trends | Trends.1 | |
|---|---|---|
| 0 | Daily SMA20 | 0.6613 |
| 1 | Daily SMA50 | 0.6663 |
| 2 | Daily SMA100 | 0.6741 |
| 3 | Daily SMA200 | 0.6691 |
The previous day high was 0.6751 while the previous day low was 0.6693. The daily 38.2% Fib levels comes at 0.6729, expected to provide support. Similarly, the daily 61.8% fib level is at 0.6715, expected to provide support.
Note the levels of interest below:
- Pivot support is noted at 0.6706, 0.6671, 0.6649
- Pivot resistance is noted at 0.6764, 0.6786, 0.6822
| Levels | Levels.1 |
|---|---|
| Previous Daily High | 0.6751 |
| Previous Daily Low | 0.6693 |
| Previous Weekly High | 0.6751 |
| Previous Weekly Low | 0.6579 |
| Previous Monthly High | 0.6818 |
| Previous Monthly Low | 0.6458 |
| Daily Fibonacci 38.2% | 0.6729 |
| Daily Fibonacci 61.8% | 0.6715 |
| Daily Pivot Point S1 | 0.6706 |
| Daily Pivot Point S2 | 0.6671 |
| Daily Pivot Point S3 | 0.6649 |
| Daily Pivot Point R1 | 0.6764 |
| Daily Pivot Point R2 | 0.6786 |
| Daily Pivot Point R3 | 0.6822 |
[/s2If]
Nehcap Expert Advisor
The NEHCAP MT4 EA is high quality professional trading system geared to generate returns without using GRID or martingales. Each trade has strict risk per trade parameter. The pairs under management include EURUSD, GBPUSD, AUDCAD, AUDNZD,GBPAUD, EURAUD, EURCAD, CHFJPY and many more.
The system is trading live: LIVE ACCOUNT TRACKING
You can run it free. Apply for a free trial and track our account. Buy the system or use profit share mechanism to generate returns on your MT4.
Join Our Telegram Group
")


