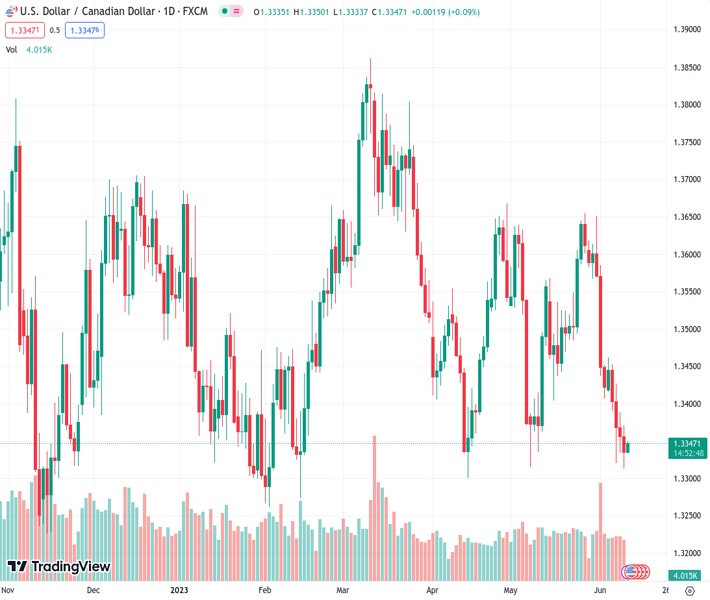
#USDCAD @ 1.33475 is gathering strength for a fresh upside move above 1.3360 as the focus shifts to US CPI and Fed policy. (Pivot Orderbook analysis)
…
This is a premium post.
[s2If !current_user_can(access_s2member_level4)]Please register for FREE REGISTER to read full post below containing analysis. In case of any error or you think you are not able to read the full post below, please email us at support#nehcap.com [lwa][/s2If] [s2If current_user_can(access_s2member_level1)]
- USD/CAD is gathering strength for a fresh upside move above 1.3360 as the focus shifts to US CPI and Fed policy.
- The US Dollar Index (DXY) has deliberating reached to near 103.70 as investors are divided about Fed’s policy decision.
- USD/CAD has witnessed decent buying interest after testing the demand zone plotted in a narrow range of 1.3300-1.3315.
The pair currently trades last at 1.33475.
The previous day high was 1.3371 while the previous day low was 1.3313. The daily 38.2% Fib levels comes at 1.3335, expected to provide support. Similarly, the daily 61.8% fib level is at 1.3349, expected to provide resistance.
The USD/CAD pair is gathering strength for a fresh rally around 1.3350 ahead of the release of the United States Consumer Price Index (CPI) and the interest rate decision by the Federal Reserve (Fed). The Loonie asset is expected to remain in the bullish trajectory as anxiety among investors is deepening due to critical economic events.
S&P500 futures have posted decent gains in the Asian session. US equities remained choppy on Friday but managed to settle on a positive note. The overall market sentiment is risk-on, however, mild caution cannot be ruled out.
The US Dollar Index (DXY) has deliberating reached to near 103.70 as investors are divided about Fed’s policy decision. No doubt, United States labor market conditions are easing, the current inflation rate is more than twice the desired rate.
USD/CAD has witnessed decent buying interest after testing the demand zone plotted in a narrow range of 1.3300-1.3315 on a four-hour scale. The 20-period Exponential Moving Average (EMA) at 1.3363 is still acting as a barricade for the US Dollar bulls. Horizontal resistance is plotted around June 05 high at 1.3462.
The Relative Strength Index (RSI) (14) has tried to ditch the bearish range of 20.00-40.00 and enter into the 40.00-60.00 range, indicating an attempt of a bullish reversal.
Should the asset break above June 08 high at 1.3388, US Dollar bulls will drive the asset toward June 05 high at 1.3462 and the psychological resistance at 1.3500.
On the flip side, a breakdown below the round-levels support of 1.3300 will expose the Loonie asset to a fresh four-month low around 1.3274 followed by 15 November 2022 low at 1.3226.
Technical Levels: Supports and Resistances
USDCAD currently trading at 1.3354 at the time of writing. Pair opened at 1.3338 and is trading with a change of 0.12 % .
| Overview | Overview.1 | |
|---|---|---|
| 0 | Today last price | 1.3354 |
| 1 | Today Daily Change | 0.0016 |
| 2 | Today Daily Change % | 0.1200 |
| 3 | Today daily open | 1.3338 |
The pair remains strongly bearish on the daily time frame. It trades below the 20 SMA @ 1.3492, 50 SMA 1.3488, 100 SMA @ 1.3515 and 200 SMA @ 1.3514.
| Trends | Trends.1 | |
|---|---|---|
| 0 | Daily SMA20 | 1.3492 |
| 1 | Daily SMA50 | 1.3488 |
| 2 | Daily SMA100 | 1.3515 |
| 3 | Daily SMA200 | 1.3514 |
The previous day high was 1.3371 while the previous day low was 1.3313. The daily 38.2% Fib levels comes at 1.3335, expected to provide support. Similarly, the daily 61.8% fib level is at 1.3349, expected to provide resistance.
Note the levels of interest below:
- Pivot support is noted at 1.331, 1.3283, 1.3252
- Pivot resistance is noted at 1.3368, 1.3399, 1.3426
| Levels | Levels.1 |
|---|---|
| Previous Daily High | 1.3371 |
| Previous Daily Low | 1.3313 |
| Previous Weekly High | 1.3462 |
| Previous Weekly Low | 1.3313 |
| Previous Monthly High | 1.3655 |
| Previous Monthly Low | 1.3315 |
| Daily Fibonacci 38.2% | 1.3335 |
| Daily Fibonacci 61.8% | 1.3349 |
| Daily Pivot Point S1 | 1.3310 |
| Daily Pivot Point S2 | 1.3283 |
| Daily Pivot Point S3 | 1.3252 |
| Daily Pivot Point R1 | 1.3368 |
| Daily Pivot Point R2 | 1.3399 |
| Daily Pivot Point R3 | 1.3426 |
[/s2If]
Nehcap Expert Advisor
The NEHCAP MT4 EA is high quality professional trading system geared to generate returns without using GRID or martingales. Each trade has strict risk per trade parameter. The pairs under management include EURUSD, GBPUSD, AUDCAD, AUDNZD,GBPAUD, EURAUD, EURCAD, CHFJPY and many more.
The system is trading live: LIVE ACCOUNT TRACKING
You can run it free. Apply for a free trial and track our account. Buy the system or use profit share mechanism to generate returns on your MT4.
Join Our Telegram Group
")


