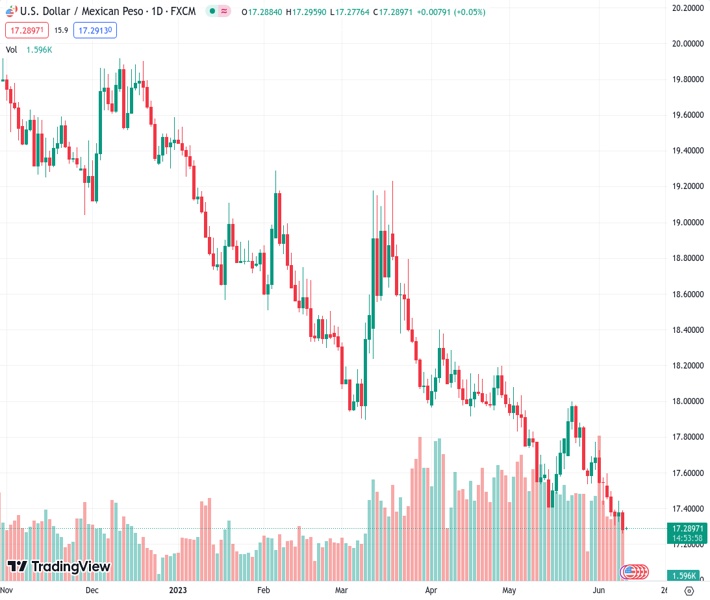
#USDMXN @ 17.2875 fades bounce off the lowest level since May 2016., @nehcap view: Limited downside expected (Pivot Orderbook analysis)
…
This is a premium post.
[s2If !current_user_can(access_s2member_level4)]Please register for FREE REGISTER to read full post below containing analysis. In case of any error or you think you are not able to read the full post below, please email us at support#nehcap.com [lwa][/s2If] [s2If current_user_can(access_s2member_level1)]
- USD/MXN fades bounce off the lowest level since May 2016.
- Fortnight-old support line, oversold RSI (14) line challenge Mexican Peso buyers.
- 50-SMA restricts short-term USD/MXN upside ahead of the key 200-SMA hurdle.
- Multiple support lines, year 2016 bottom stand tall to challenge pair sellers.
The pair currently trades last at 17.2875.
The previous day high was 17.3893 while the previous day low was 17.2591. The daily 38.2% Fib levels comes at 17.3088, expected to provide resistance. Similarly, the daily 61.8% fib level is at 17.3396, expected to provide resistance.
USD/MXN consolidates the biggest daily loss in nearly two weeks at the lowest levels since May 2016 heading into Monday’s European session. In doing so, the Mexican Peso (MXN) pair traces the market’s cautious mood, as well as positioning for the US inflation and Federal Reserve (Fed) monetary policy decision.
Technically, the USD/MXN pair struggle to defend the previous day’s bounce off a downward-sloping support line from May 29 amid oversold RSI (14).
Not only the oversold RSI conditions and the short-term support line, around 17.23 by the press time, but a three-month-old descending trend line, close to 17.21 at the latest, also challenge the USD/MXN bears.
It’s worth noting that a falling support line from early April, close to 17.06, precedes the year 2016 bottom of around 17.05 and the 17.00 round figure to challenge the Mexican Peso pair’s further declines.
On the contrary, the 50-SMA level of around 17.47 restricts the immediate upside of the USD/MXN pair ahead of the 200-SMA hurdle of 17.69.
In a case where the USD/MXN bulls manage to keep the reins past 17.69, as well as cross the 17.70 round figure, the corrective bounce may aim for the late May peak of around 17.99.
Trend: Limited downside expected
Technical Levels: Supports and Resistances
USDMXN currently trading at 17.2908 at the time of writing. Pair opened at 17.2807 and is trading with a change of 0.06% % .
| Overview | Overview.1 | |
|---|---|---|
| 0 | Today last price | 17.2908 |
| 1 | Today Daily Change | 0.0101 |
| 2 | Today Daily Change % | 0.06% |
| 3 | Today daily open | 17.2807 |
The pair remains strongly bearish on the daily time frame. It trades below the 20 SMA @ 17.6062, 50 SMA 17.8325, 100 SMA @ 18.1817 and 200 SMA @ 18.9176.
| Trends | Trends.1 | |
|---|---|---|
| 0 | Daily SMA20 | 17.6062 |
| 1 | Daily SMA50 | 17.8325 |
| 2 | Daily SMA100 | 18.1817 |
| 3 | Daily SMA200 | 18.9176 |
The previous day high was 17.3893 while the previous day low was 17.2591. The daily 38.2% Fib levels comes at 17.3088, expected to provide resistance. Similarly, the daily 61.8% fib level is at 17.3396, expected to provide resistance.
Note the levels of interest below:
- Pivot support is noted at 17.2301, 17.1795, 17.0999
- Pivot resistance is noted at 17.3603, 17.4399, 17.4905
| Levels | Levels.1 |
|---|---|
| Previous Daily High | 17.3893 |
| Previous Daily Low | 17.2591 |
| Previous Weekly High | 17.5981 |
| Previous Weekly Low | 17.2591 |
| Previous Monthly High | 18.0780 |
| Previous Monthly Low | 17.4203 |
| Daily Fibonacci 38.2% | 17.3088 |
| Daily Fibonacci 61.8% | 17.3396 |
| Daily Pivot Point S1 | 17.2301 |
| Daily Pivot Point S2 | 17.1795 |
| Daily Pivot Point S3 | 17.0999 |
| Daily Pivot Point R1 | 17.3603 |
| Daily Pivot Point R2 | 17.4399 |
| Daily Pivot Point R3 | 17.4905 |
[/s2If]
Nehcap Expert Advisor
The NEHCAP MT4 EA is high quality professional trading system geared to generate returns without using GRID or martingales. Each trade has strict risk per trade parameter. The pairs under management include EURUSD, GBPUSD, AUDCAD, AUDNZD,GBPAUD, EURAUD, EURCAD, CHFJPY and many more.
The system is trading live: LIVE ACCOUNT TRACKING
You can run it free. Apply for a free trial and track our account. Buy the system or use profit share mechanism to generate returns on your MT4.
Join Our Telegram Group
")


