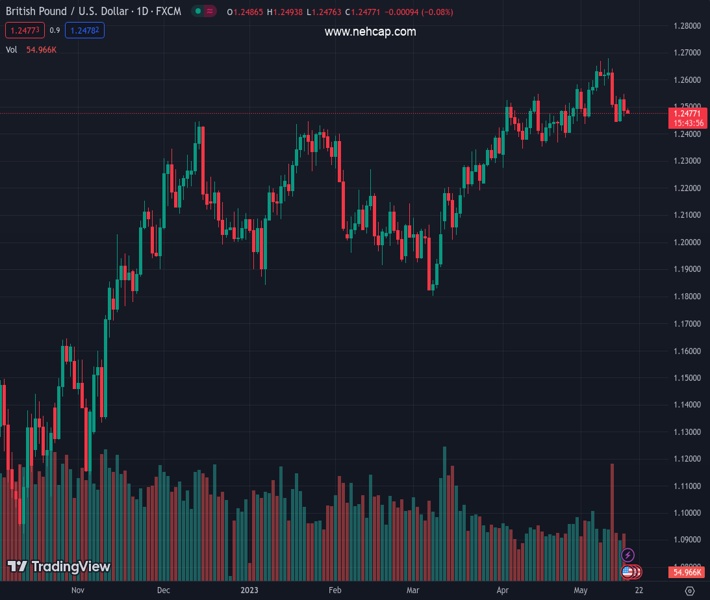
#GBPUSD @ 1.24791 is juggling in a narrow range above 1.2480 amid sideways performance by the USD Index. (Pivot Orderbook analysis)
…
This is a premium post.
[s2If !current_user_can(access_s2member_level4)]Please register for FREE REGISTER to read full post below containing analysis. In case of any error or you think you are not able to read the full post below, please email us at support#nehcap.com [lwa][/s2If] [s2If current_user_can(access_s2member_level1)]
- GBP/USD is juggling in a narrow range above 1.2480 amid sideways performance by the USD Index.
- Weak UK Employment data has provided some relief to BoE policymakers.
- GBP/USD is hovering near the lower portion of the Rising Channel pattern plotted at 1.2276.
The pair currently trades last at 1.24791.
The previous day high was 1.2547 while the previous day low was 1.2465. The daily 38.2% Fib levels comes at 1.2496, expected to provide resistance. Similarly, the daily 61.8% fib level is at 1.2516, expected to provide resistance.
The GBP/USD pair is demonstrating a back-and-forth action above 1.2480 in the early European session. The Cable is struggling to find any decisive move, following the footprints of the sideways US Dollar Index (DXY). The US Dollar Index (DXY) is auctioning topsy-turvy below the immediate resistance of 102.70.
The FX domain failed to show any action despite discussions over the US debt-ceiling postponed further to later this week. However, US President Joe Biden has cleared that he will remain in touch with Speaker McCarthy each day to resolve negotiations.
Meanwhile, weak United Kingdom Employment data has provided some relief to Bank of England (BoE) policymakers. Investors should note that labor shortages and historically high food inflation have remained major catalysts for double-digit UK inflation.
GBP/USD is hovering near the lower portion of the Rising Channel chart pattern plotted from April 03 low at 1.2276. The upper portion of the aforementioned chart pattern is placed from April 04 high at 1.2525. The 20-period Exponential Moving Average (EMA) has restricted the upside of the Pound Sterling.
The Relative Strength Index (RSI) (14) seems vulnerable in the 40.00-60.00 range, A sharp slippage below 40.00 will trigger the downside momentum.
A downside move below May 12 low at 1.2440 will trigger a breakdown of the Rising Channel pattern and will expose the Cable to April 21 low at 1.2367 followed by April 03 low at 1.2276.
On the flip side, a recovery move above May 09 high at 1.2640 will drive the major toward the round-level resistance at 1.2700 and 26 April 2022 high at 1.2772.
Technical Levels: Supports and Resistances
GBPUSD currently trading at 1.2478 at the time of writing. Pair opened at 1.2489 and is trading with a change of -0.09 % .
| Overview | Overview.1 | |
|---|---|---|
| 0 | Today last price | 1.2478 |
| 1 | Today Daily Change | -0.0011 |
| 2 | Today Daily Change % | -0.0900 |
| 3 | Today daily open | 1.2489 |
The pair is trading below its 20 Daily moving average @ 1.2516, above its 50 Daily moving average @ 1.238 , above its 100 Daily moving average @ 1.2258 and above its 200 Daily moving average @ 1.1965
| Trends | Trends.1 | |
|---|---|---|
| 0 | Daily SMA20 | 1.2516 |
| 1 | Daily SMA50 | 1.2380 |
| 2 | Daily SMA100 | 1.2258 |
| 3 | Daily SMA200 | 1.1965 |
The previous day high was 1.2547 while the previous day low was 1.2465. The daily 38.2% Fib levels comes at 1.2496, expected to provide resistance. Similarly, the daily 61.8% fib level is at 1.2516, expected to provide resistance.
Note the levels of interest below:
- Pivot support is noted at 1.2454, 1.2419, 1.2373
- Pivot resistance is noted at 1.2535, 1.2582, 1.2617
| Levels | Levels.1 |
|---|---|
| Previous Daily High | 1.2547 |
| Previous Daily Low | 1.2465 |
| Previous Weekly High | 1.2680 |
| Previous Weekly Low | 1.2440 |
| Previous Monthly High | 1.2584 |
| Previous Monthly Low | 1.2275 |
| Daily Fibonacci 38.2% | 1.2496 |
| Daily Fibonacci 61.8% | 1.2516 |
| Daily Pivot Point S1 | 1.2454 |
| Daily Pivot Point S2 | 1.2419 |
| Daily Pivot Point S3 | 1.2373 |
| Daily Pivot Point R1 | 1.2535 |
| Daily Pivot Point R2 | 1.2582 |
| Daily Pivot Point R3 | 1.2617 |
[/s2If]
Nehcap Expert Advisor
The NEHCAP MT4 EA is high quality professional trading system geared to generate returns without using GRID or martingales. Each trade has strict risk per trade parameter. The pairs under management include EURUSD, GBPUSD, AUDCAD, AUDNZD,GBPAUD, EURAUD, EURCAD, CHFJPY and many more.
The system is trading live: LIVE ACCOUNT TRACKING
You can run it free. Apply for a free trial and track our account. Buy the system or use profit share mechanism to generate returns on your MT4.
Join Our Telegram Group
")


