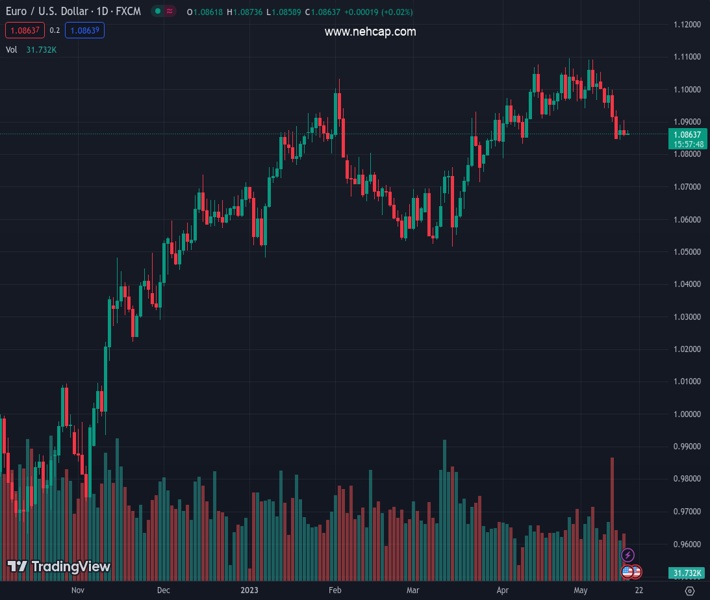
#EURUSD @ 1.08646 has faced selling interest after a short-lived pullback to near 1.0873. (Pivot Orderbook analysis)
…
This is a premium post.
[s2If !current_user_can(access_s2member_level4)]Please register for FREE REGISTER to read full post below containing analysis. In case of any error or you think you are not able to read the full post below, please email us at support#nehcap.com [lwa][/s2If] [s2If current_user_can(access_s2member_level1)]
- EUR/USD has faced selling interest after a short-lived pullback to near 1.0873.
- A mild expansion is US Retail Sales is insufficient to impact expectations for a steady monetary policy by the Federal Reserve.
- The street is anticipating more than one interest rate hike from European Central Bank.
- EUR/USD has dropped below the 38.2% Fibonacci retracement at 1.0876.
The pair currently trades last at 1.08646.
The previous day high was 1.0904 while the previous day low was 1.0855. The daily 38.2% Fib levels comes at 1.0874, expected to provide resistance. Similarly, the daily 61.8% fib level is at 1.0886, expected to provide resistance.
EUR/USD has sensed selling pressure around 1.0873 after a less-confident recovery move as the US Dollar Index (DXY) is preparing for coming out of the woods and climbing above the immediate resistance of 102.70. The major currency pair witnessed an intense sell-off on Tuesday after the release of the preliminary Eurozone Q1 Gross Domestic Product (GDP) data.
S&P500 futures have generated some decent gains in Asia, and managed to battle against the bearish sentiment faced on Tuesday. It seems that appeal of US equities has improved despite fears of catastrophic default by the United States Treasury have deepened further. The USD Index is displaying a sideways performance after a solid recovery to near 102.70. A continuation of sideways performance is expected from the USD Index as US debt-ceiling negotiations have been further postponed to later this week.
The postponement of approval for debt-ceiling cap has improved demand for US government bonds. This has led to a decline in 10-year US Treasury yields below 3.53%.
Investors were keenly awaiting the approval of raising the US borrowing cap by Republican House of Representatives Joseph McCarthy, keeping in mind that President’s spending initiatives will get reduced. However, the decision of raising debt-ceiling to safeguard the US Treasury from making default on obligated payments was postponed further to later this week.
From the meeting, one thing is for sure the proposal of default is off the table as every delegate agreed that a higher debt-ceiling along with widened budget deficit due to higher spending initiatives will be a disaster. US President Joe Biden has cleared that he will remain in touch with Speaker McCarthy each day to resolve negotiations.
A further delay in US debt-ceiling decision has deepened fears of a default by the US Treasury. US Treasury Secretary Janet Yellen has already warned that the Federal will be out of funds in early June and a default would result in the loss of millions of jobs, a contraction in GDP, and a situation of recession in the United States economy.
On Tuesday, monthly US Retail Sales data (April) expanded at a slower pace at 0.4% against the estimate of 0.7%. It is worth noting that the retail demand was contracted by 0.7% in March. Higher inflation is biting households’ pocket that is resulting in weak demand and showing consistent weight on US inflation. A mild expansion is insufficient to impact expectations for a steady monetary policy by the Federal Reserve (Fed), however, a persistent nature could force the central bank to raise interest rates further.
Atlanta Federal Reserve President Raphael Bostic said “It is unclear what the Federal Reserve would do in the case of a debt default”. He further added that a stick US inflation and rising unemployment will put immense pressure on the Federal Reserve.
European Central Bank (ECB) policymakers have been very confident of solid demand and labor shortage in Eurozone. Therefore, the need for more interest rate hikes is warranted as inflation is far from desired levels. The street is anticipating more than one interest rate hike from European Central Bank President Christine Lagarde as announced in the last monetary policy meeting.
On Tuesday, the Euro bulls faced a sell-off despite Eurozone GDP match estimates. Quarterly and annual GDP maintained the pace at 0.1% and 1.3% respectively.
EUR/USD has dropped below the 38.2% Fibonacci retracement (placed from March 15 low at 1.0516 to April 26 high at 1.1095) at 1.0876 on a four-hour scale. The downward-sloping trendline from May 04 high at 1.1077 will act as a barricade for the Euro bulls.
Also, the 20-period Exponential Moving Average (EMA) at 1.0883 is restricting the upside for the shared currency bulls.
The Relative Strength Index (RSI) (14) is oscillating in the bearish range of 20.00-40.00, indicating more weakness ahead.
Technical Levels: Supports and Resistances
EURUSD currently trading at 1.0863 at the time of writing. Pair opened at 1.0862 and is trading with a change of 0.01 % .
| Overview | Overview.1 | |
|---|---|---|
| 0 | Today last price | 1.0863 |
| 1 | Today Daily Change | 0.0001 |
| 2 | Today Daily Change % | 0.0100 |
| 3 | Today daily open | 1.0862 |
The pair is trading below its 20 Daily moving average @ 1.0977, below its 50 Daily moving average @ 1.0881 , above its 100 Daily moving average @ 1.0804 and above its 200 Daily moving average @ 1.0459
| Trends | Trends.1 | |
|---|---|---|
| 0 | Daily SMA20 | 1.0977 |
| 1 | Daily SMA50 | 1.0881 |
| 2 | Daily SMA100 | 1.0804 |
| 3 | Daily SMA200 | 1.0459 |
The previous day high was 1.0904 while the previous day low was 1.0855. The daily 38.2% Fib levels comes at 1.0874, expected to provide resistance. Similarly, the daily 61.8% fib level is at 1.0886, expected to provide resistance.
Note the levels of interest below:
- Pivot support is noted at 1.0843, 1.0824, 1.0794
- Pivot resistance is noted at 1.0893, 1.0923, 1.0942
| Levels | Levels.1 |
|---|---|
| Previous Daily High | 1.0904 |
| Previous Daily Low | 1.0855 |
| Previous Weekly High | 1.1054 |
| Previous Weekly Low | 1.0848 |
| Previous Monthly High | 1.1095 |
| Previous Monthly Low | 1.0788 |
| Daily Fibonacci 38.2% | 1.0874 |
| Daily Fibonacci 61.8% | 1.0886 |
| Daily Pivot Point S1 | 1.0843 |
| Daily Pivot Point S2 | 1.0824 |
| Daily Pivot Point S3 | 1.0794 |
| Daily Pivot Point R1 | 1.0893 |
| Daily Pivot Point R2 | 1.0923 |
| Daily Pivot Point R3 | 1.0942 |
[/s2If]
Nehcap Expert Advisor
The NEHCAP MT4 EA is high quality professional trading system geared to generate returns without using GRID or martingales. Each trade has strict risk per trade parameter. The pairs under management include EURUSD, GBPUSD, AUDCAD, AUDNZD,GBPAUD, EURAUD, EURCAD, CHFJPY and many more.
The system is trading live: LIVE ACCOUNT TRACKING
You can run it free. Apply for a free trial and track our account. Buy the system or use profit share mechanism to generate returns on your MT4.
Join Our Telegram Group
")


