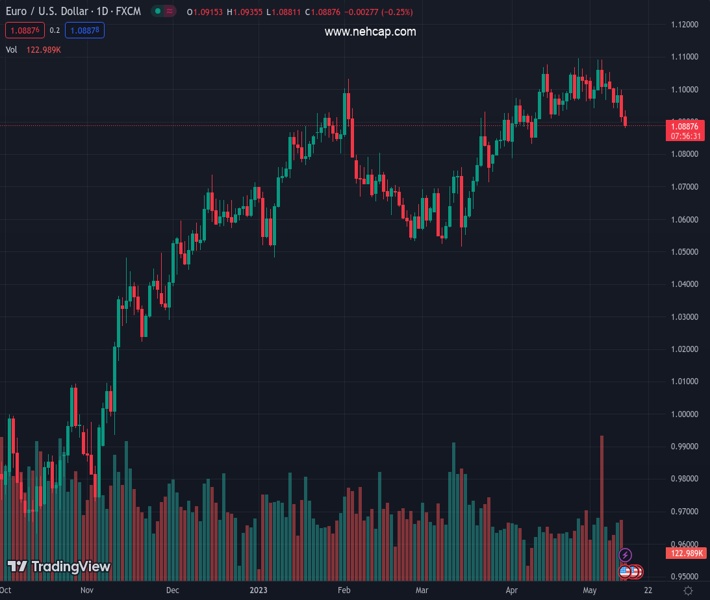
#EURUSD @ 1.08887 accelerates the decline and drops to 1.0890. (Pivot Orderbook analysis)
…
This is a premium post.
[s2If !current_user_can(access_s2member_level4)]Please register for FREE REGISTER to read full post below containing analysis. In case of any error or you think you are not able to read the full post below, please email us at support#nehcap.com [lwa][/s2If] [s2If current_user_can(access_s2member_level1)]
- EUR/USD accelerates the decline and drops to 1.0890.
- The following contention area appears around 1.0830.
The pair currently trades last at 1.08887.
The previous day high was 1.0998 while the previous day low was 1.09. The daily 38.2% Fib levels comes at 1.0938, expected to provide resistance. Similarly, the daily 61.8% fib level is at 1.0961, expected to provide resistance.
The pessimism around EUR/USD gathers further traction in the second half of the week and drags the pair back to the 1.0890 region, or multi-week lows, on Friday.
If bears remain in control, spot could initially revisit the interim 55-day SMA at 1.0847 ahead of the weekly low at 1.0831 (April 10).
Looking at the longer run, the constructive view remains unchanged while above the 200-day SMA, today at 1.0451.
Technical Levels: Supports and Resistances
EURUSD currently trading at 1.0904 at the time of writing. Pair opened at 1.0916 and is trading with a change of -0.11 % .
| Overview | Overview.1 | |
|---|---|---|
| 0 | Today last price | 1.0904 |
| 1 | Today Daily Change | 43.0000 |
| 2 | Today Daily Change % | -0.1100 |
| 3 | Today daily open | 1.0916 |
The pair is trading below its 20 Daily moving average @ 1.0992, above its 50 Daily moving average @ 1.0867 , above its 100 Daily moving average @ 1.0797 and above its 200 Daily moving average @ 1.0449
| Trends | Trends.1 | |
|---|---|---|
| 0 | Daily SMA20 | 1.0992 |
| 1 | Daily SMA50 | 1.0867 |
| 2 | Daily SMA100 | 1.0797 |
| 3 | Daily SMA200 | 1.0449 |
The previous day high was 1.0998 while the previous day low was 1.09. The daily 38.2% Fib levels comes at 1.0938, expected to provide resistance. Similarly, the daily 61.8% fib level is at 1.0961, expected to provide resistance.
Note the levels of interest below:
- Pivot support is noted at 1.0878, 1.084, 1.078
- Pivot resistance is noted at 1.0976, 1.1036, 1.1074
| Levels | Levels.1 |
|---|---|
| Previous Daily High | 1.0998 |
| Previous Daily Low | 1.0900 |
| Previous Weekly High | 1.1092 |
| Previous Weekly Low | 1.0942 |
| Previous Monthly High | 1.1095 |
| Previous Monthly Low | 1.0788 |
| Daily Fibonacci 38.2% | 1.0938 |
| Daily Fibonacci 61.8% | 1.0961 |
| Daily Pivot Point S1 | 1.0878 |
| Daily Pivot Point S2 | 1.0840 |
| Daily Pivot Point S3 | 1.0780 |
| Daily Pivot Point R1 | 1.0976 |
| Daily Pivot Point R2 | 1.1036 |
| Daily Pivot Point R3 | 1.1074 |
[/s2If]
Nehcap Expert Advisor
The NEHCAP MT4 EA is high quality professional trading system geared to generate returns without using GRID or martingales. Each trade has strict risk per trade parameter. The pairs under management include EURUSD, GBPUSD, AUDCAD, AUDNZD,GBPAUD, EURAUD, EURCAD, CHFJPY and many more.
The system is trading live: LIVE ACCOUNT TRACKING
You can run it free. Apply for a free trial and track our account. Buy the system or use profit share mechanism to generate returns on your MT4.
Join Our Telegram Group
")


