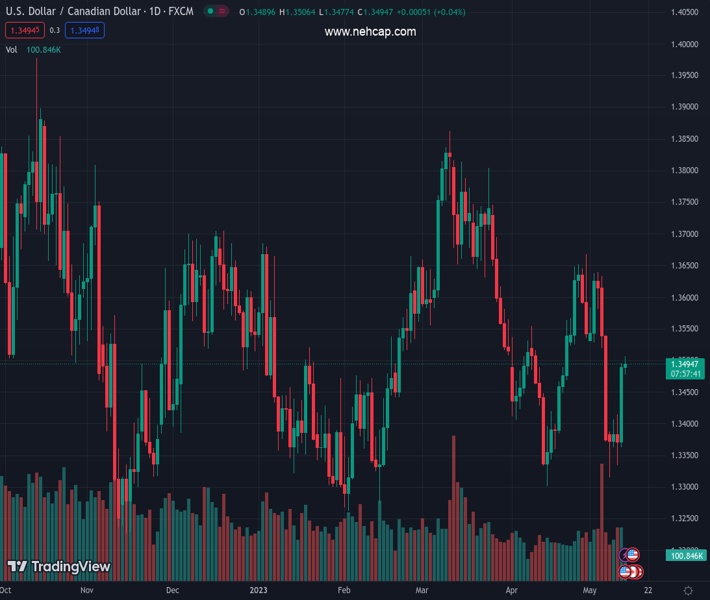
#USDCAD @ 1.34958 touches a fresh weekly high on Friday, though remains below the 100-day SMA. (Pivot Orderbook analysis)
…
This is a premium post.
[s2If !current_user_can(access_s2member_level4)]Please register for FREE REGISTER to read full post below containing analysis. In case of any error or you think you are not able to read the full post below, please email us at support#nehcap.com [lwa][/s2If] [s2If current_user_can(access_s2member_level1)]
- USD/CAD touches a fresh weekly high on Friday, though remains below the 100-day SMA.
- Sliding Oil prices undermines the Loonie and lends support amid a modest USD strength.
- A positive risk tone caps the safe-haven buck and caps any further gains for the major.
The pair currently trades last at 1.34958.
The previous day high was 1.3496 while the previous day low was 1.3363. The daily 38.2% Fib levels comes at 1.3445, expected to provide support. Similarly, the daily 61.8% fib level is at 1.3414, expected to provide support.
The USD/CAD pair attracts some buying near the 1.3475 region on Friday and climbs to a fresh weekly high heading into the North American session. The pair is currently placed around the 1.3500 round-figure mark, up for the second straight day, with bulls now awaiting a move beyond the 100-day Simple Moving Average (SMA) before placing fresh bets.
Crude Oil prices remain under some selling pressure for the third successive day amid doubts over fuel demand this year, led by concerns about a global economic slowdown. The worries resurfaced following the release of the mixed Chinese inflation figures and weaker US labor market data on Thursday, which continue to weigh on the black liquid. This, in turn, is seen undermining the commodity-linked Loonie, which, along with some follow-through US Dollar (USD) buying, acts as a tailwind for the USD/CAD pair.
In fact, the USD Index (DXY), which tracks the Greenback against a basket of currencies, hits a nearly two-week high in the wake of a modest uptick in the US Treasury bond yields. That said, the uncertainty about the Federal Reserve’s (Fed) next policy move might hold back the USD bulls from placing aggressive bets and cap gains for the USD/CAD pair. In fact, the US CPI report released earlier this week pointed to signs of easing inflationary pressures and might allow the Fed to pause its year-long rate-hiking cycle.
Investors, however, remain divided over the possibility of rate cuts later this year. Apart from this, concerns about the US debt ceiling and a generally positive risk tone might further contribute to keeping a lid on the safe-haven buck. This makes it prudent to wait for a sustained move beyond a technically significant 100-day SMA before positioning for an extension of the USD/CAD pair’s weekly rise from the 1.3315 region. Traders now look to the release of the Preliminary Michigan US Consumer Sentiment Index for a fresh impetus.
Technical Levels: Supports and Resistances
USDCAD currently trading at 1.3499 at the time of writing. Pair opened at 1.3492 and is trading with a change of 0.05 % .
| Overview | Overview.1 | |
|---|---|---|
| 0 | Today last price | 1.3499 |
| 1 | Today Daily Change | 0.0007 |
| 2 | Today Daily Change % | 0.0500 |
| 3 | Today daily open | 1.3492 |
The pair is trading above its 20 Daily moving average @ 1.3495, below its 50 Daily moving average @ 1.357 , below its 100 Daily moving average @ 1.3515 and above its 200 Daily moving average @ 1.3457
| Trends | Trends.1 | |
|---|---|---|
| 0 | Daily SMA20 | 1.3495 |
| 1 | Daily SMA50 | 1.3570 |
| 2 | Daily SMA100 | 1.3515 |
| 3 | Daily SMA200 | 1.3457 |
The previous day high was 1.3496 while the previous day low was 1.3363. The daily 38.2% Fib levels comes at 1.3445, expected to provide support. Similarly, the daily 61.8% fib level is at 1.3414, expected to provide support.
Note the levels of interest below:
- Pivot support is noted at 1.3405, 1.3318, 1.3273
- Pivot resistance is noted at 1.3537, 1.3583, 1.367
| Levels | Levels.1 |
|---|---|
| Previous Daily High | 1.3496 |
| Previous Daily Low | 1.3363 |
| Previous Weekly High | 1.3639 |
| Previous Weekly Low | 1.3371 |
| Previous Monthly High | 1.3668 |
| Previous Monthly Low | 1.3301 |
| Daily Fibonacci 38.2% | 1.3445 |
| Daily Fibonacci 61.8% | 1.3414 |
| Daily Pivot Point S1 | 1.3405 |
| Daily Pivot Point S2 | 1.3318 |
| Daily Pivot Point S3 | 1.3273 |
| Daily Pivot Point R1 | 1.3537 |
| Daily Pivot Point R2 | 1.3583 |
| Daily Pivot Point R3 | 1.3670 |
[/s2If]
Nehcap Expert Advisor
The NEHCAP MT4 EA is high quality professional trading system geared to generate returns without using GRID or martingales. Each trade has strict risk per trade parameter. The pairs under management include EURUSD, GBPUSD, AUDCAD, AUDNZD,GBPAUD, EURAUD, EURCAD, CHFJPY and many more.
The system is trading live: LIVE ACCOUNT TRACKING
You can run it free. Apply for a free trial and track our account. Buy the system or use profit share mechanism to generate returns on your MT4.
Join Our Telegram Group
")


