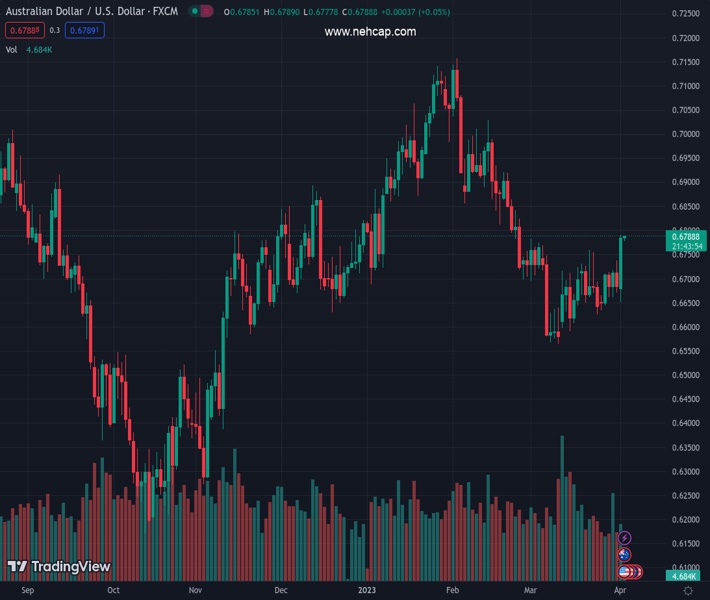
#AUDUSD @ 0.67880 grinds within a choppy range after rising the most in three months the previous day. (Pivot Orderbook analysis)
…
This is a premium post.
[s2If !current_user_can(access_s2member_level4)]Please register for PREMIUM VERSION HERE to read full post below containing analysis. In case of any error or you think you are not able to read the full post below, please email us at support#nehcap.com [lwa][/s2If] [s2If current_user_can(access_s2member_level4)]
- AUD/USD grinds within a choppy range after rising the most in three months the previous day.
- Broad US Dollar weakness, pre-RBA consolidation allowed Aussie bulls to ignore mixed data at home and in China.
- Cautious optimism underpins AUD/USD run-up despite mixed sentiment surrounding RBA.
- Clues of RBA rate hike pause will be crucial to watch and can drown the Aussie pair.
The pair currently trades last at 0.67880.
The previous day high was 0.6738 while the previous day low was 0.667. The daily 38.2% Fib levels comes at 0.6696, expected to provide support. Similarly, the daily 61.8% fib level is at 0.6712, expected to provide support.
AUD/USD bulls take a breather around 0.6785, following the biggest daily jump in three months, as markets prepare for the Reserve Bank of Australia’s (RBA) Interest Rate Decision on early Tuesday. It’s worth noting that the Aussie pair seesaws inside a 20-pip trading range in the last few hours as traders seem divided between a rate 0.25% rate hike and a status quo monetary policy meeting.
The Aussie pair cheered broad US Dollar weakness while ignoring mostly downbeat data at home, as well as from the biggest customer China, the previous day.
That said, Australia’s TD Securities Inflation eased to 0.3% MoM and 5.7% YoY for March versus 0.4% and 6.3% respective priors. Further, China’s Caixin Manufacturing PMI for March drops to 50.0 from 51.6 prior and 51.7 market forecasts.
On the other hand, the US ISM Manufacturing PMI dropped to the lowest levels since May 2020 in March, to 46.3 versus 47.5 expected and 47.7 prior. On the same line, the final readings of March’s S&P Global Manufacturing PMI eased to 49.2 compared to 49.3 initial estimations.
The downbeat US PMI data joined Friday’s softer prints of the US Core Personal Consumption Expenditure (PCE) Price Index, the Fed’s preferred inflation gauge, to weigh on the market’s Fed bets. With this, the CME’s FedWatch Tool marked nearly 43% market bets on the Fed’s 0.25% rate hike in May, versus 52% expected on Friday.
In doing so, market players fail to justify the inflation fears emanating from the OPEC+ supply cuts and recently hawkish comments from US Federal Reserve Board Governor Lisa Cook, as well as US Treasury Secretary Janet Yellent’s fears for global growth due to the OPEC+ surprise.
It should be observed that US President Joe Biden shrugged off the OPEC+ move and said that it is not as bad as you think.
Against this backdrop, Wall Street closed mixed and the yields were down while the US Dollar Index (DXY) dropped the most in a fortnight the previous day to test the lowest levels in two months.
Looking ahead, AUD/USD moves rely on the RBA’s next moves amid a close call of announcing 25 basis points (bps) of a rate hike. Even if the Aussie central bank announces the rate hike, the bears could sneak in if the RBA Statement utters a policy pivot.
Also read: Reserve Bank of Australia Preview: To pause or not to pause
A daily closing beyond the 100-DMA, around 0.6800 by the press time, becomes necessary for the AUD/USD bulls to keep the reins.
Technical Levels: Supports and Resistances
AUDUSD currently trading at 0.6786 at the time of writing. Pair opened at 0.6686 and is trading with a change of 1.50% % .
| Overview | Overview.1 | |
|---|---|---|
| 0 | Today last price | 0.6786 |
| 1 | Today Daily Change | 0.0100 |
| 2 | Today Daily Change % | 1.50% |
| 3 | Today daily open | 0.6686 |
The pair is trading above its 20 Daily moving average @ 0.6662, below its 50 Daily moving average @ 0.6819 , below its 100 Daily moving average @ 0.68 and above its 200 Daily moving average @ 0.6752
| Trends | Trends.1 | |
|---|---|---|
| 0 | Daily SMA20 | 0.6662 |
| 1 | Daily SMA50 | 0.6819 |
| 2 | Daily SMA100 | 0.6800 |
| 3 | Daily SMA200 | 0.6752 |
The previous day high was 0.6738 while the previous day low was 0.667. The daily 38.2% Fib levels comes at 0.6696, expected to provide support. Similarly, the daily 61.8% fib level is at 0.6712, expected to provide support.
Note the levels of interest below:
- Pivot support is noted at 0.6658, 0.6631, 0.6591
- Pivot resistance is noted at 0.6725, 0.6765, 0.6793
| Levels | Levels.1 |
|---|---|
| Previous Daily High | 0.6738 |
| Previous Daily Low | 0.6670 |
| Previous Weekly High | 0.6738 |
| Previous Weekly Low | 0.6634 |
| Previous Monthly High | 0.6784 |
| Previous Monthly Low | 0.6564 |
| Daily Fibonacci 38.2% | 0.6696 |
| Daily Fibonacci 61.8% | 0.6712 |
| Daily Pivot Point S1 | 0.6658 |
| Daily Pivot Point S2 | 0.6631 |
| Daily Pivot Point S3 | 0.6591 |
| Daily Pivot Point R1 | 0.6725 |
| Daily Pivot Point R2 | 0.6765 |
| Daily Pivot Point R3 | 0.6793 |
[/s2If]
Join Our Telegram Group
")


