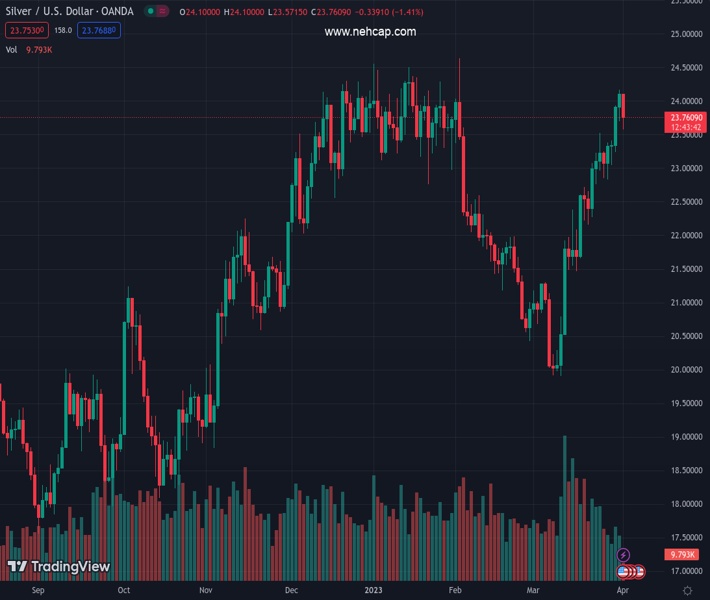
#XAGUSD @ 23.755 Silver comes under heavy selling pressure on Monday, though lacks follow-through. (Pivot Orderbook analysis)
…
This is a premium post.
[s2If !current_user_can(access_s2member_level4)]Please register for PREMIUM VERSION HERE to read full post below containing analysis. In case of any error or you think you are not able to read the full post below, please email us at support#nehcap.com [lwa][/s2If] [s2If current_user_can(access_s2member_level4)]
- Silver comes under heavy selling pressure on Monday, though lacks follow-through.
- The technical setup still supports prospects for the emergence of some dip-buying.
- A convincing break below the $23.00 mark is needed to negate the positive outlook.
The pair currently trades last at 23.755.
The previous day high was 24.16 while the previous day low was 23.7. The daily 38.2% Fib levels comes at 23.98, expected to provide resistance. Similarly, the daily 61.8% fib level is at 23.87, expected to provide resistance.
Silver kicks off the new week on a downbeat note and snaps a four-day winning streak to a nearly two-month high, around the $24.15 region touched on Friday. The white metal maintains its offered tone through the early part of the European session and trades around the $23.75 zone, down over 1.30% for the day.
From a technical perspective, the recent strong move up from the YTD low – levels just below the $20.00 psychological mark, stalls ahead of the $24.20-$24.25 static resistance, which should now act as a pivotal point. Some follow-through buying, leading to a subsequent strength beyond the multi-month peak, around the $24.60-$24.65 area touched in February, will b seen as a fresh trigger for bullish traders.
Given that oscillators on the daily chart have pulled back from overbought territory, the XAG/USD might then aim to reclaim the $25.00 psychological mark for the first time since April 2022. The upward trajectory could get extended further towards the next relevant hurdle near the $25.75-$25.80 region en route to the $26.00 round-figure mark and the April 2022 swing high, around the $26.20-$26.25 area.
On the flip side, the daily low, just ahead of the mid-$23.00s, now seems to protect the immediate downside. Any subsequent slide is more likely to attract fresh buyers near the $23.00 mark and remain limited near the $22.80-$22.75 region. That said, a convincing break below might prompt some technical selling and drag the XAG/USD towards the $22.25 intermediate support en route to the $22.00 round-figure mark.
Technical Levels: Supports and Resistances
XAGUSD currently trading at 23.76 at the time of writing. Pair opened at 24.08 and is trading with a change of -1.33 % .
| Overview | Overview.1 | |
|---|---|---|
| 0 | Today last price | 23.76 |
| 1 | Today Daily Change | -0.32 |
| 2 | Today Daily Change % | -1.33 |
| 3 | Today daily open | 24.08 |
The pair remains strongly bullish on the daily timeframe. It trades above its 20 SMA @ 22.17, 50 SMA 22.21, 100 SMA @ 22.59 and 200 SMA @ 21.03.
| Trends | Trends.1 | |
|---|---|---|
| 0 | Daily SMA20 | 22.17 |
| 1 | Daily SMA50 | 22.21 |
| 2 | Daily SMA100 | 22.59 |
| 3 | Daily SMA200 | 21.03 |
The previous day high was 24.16 while the previous day low was 23.7. The daily 38.2% Fib levels comes at 23.98, expected to provide resistance. Similarly, the daily 61.8% fib level is at 23.87, expected to provide resistance.
Note the levels of interest below:
- Pivot support is noted at 23.8, 23.51, 23.33
- Pivot resistance is noted at 24.27, 24.45, 24.73
| Levels | Levels.1 |
|---|---|
| Previous Daily High | 24.16 |
| Previous Daily Low | 23.70 |
| Previous Weekly High | 24.16 |
| Previous Weekly Low | 22.83 |
| Previous Monthly High | 24.16 |
| Previous Monthly Low | 19.90 |
| Daily Fibonacci 38.2% | 23.98 |
| Daily Fibonacci 61.8% | 23.87 |
| Daily Pivot Point S1 | 23.80 |
| Daily Pivot Point S2 | 23.51 |
| Daily Pivot Point S3 | 23.33 |
| Daily Pivot Point R1 | 24.27 |
| Daily Pivot Point R2 | 24.45 |
| Daily Pivot Point R3 | 24.73 |
[/s2If]
Join Our Telegram Group


