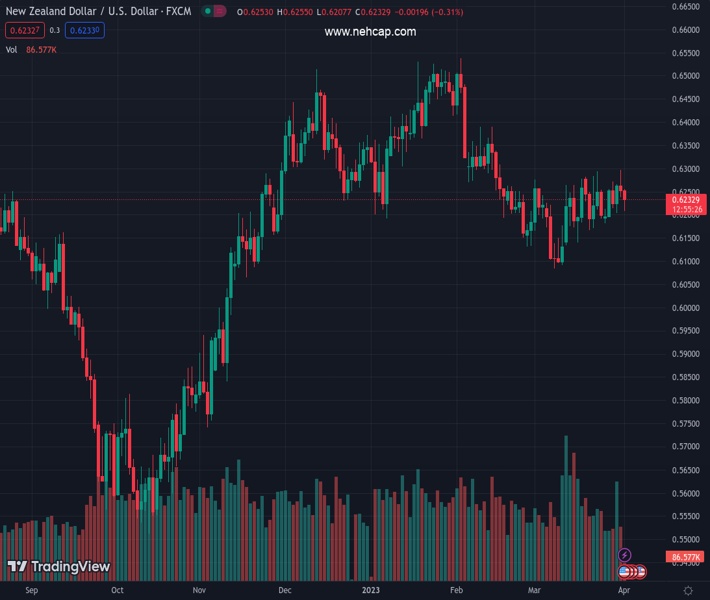
#NZDUSD @ 0.62362 attracts aggressive sellers on Monday amid broad-based USD strength. (Pivot Orderbook analysis)
…
This is a premium post.
[s2If !current_user_can(access_s2member_level4)]Please register for PREMIUM VERSION HERE to read full post below containing analysis. In case of any error or you think you are not able to read the full post below, please email us at support#nehcap.com [lwa][/s2If] [s2If current_user_can(access_s2member_level4)]
- NZD/USD attracts aggressive sellers on Monday amid broad-based USD strength.
- A sharp rise in Oil prices lifts bets for more Fed rate hikes and boosts the buck.
- The market focus now shifts to this week’s US macro data and the RBNZ meeting.
The pair currently trades last at 0.62362.
The previous day high was 0.6298 while the previous day low was 0.6237. The daily 38.2% Fib levels comes at 0.6261, expected to provide resistance. Similarly, the daily 61.8% fib level is at 0.6275, expected to provide resistance.
The NZD/USD pair comes under heavy selling pressure on the first day of a new week and extends Friday’s rejection slide from the vicinity of the 0.6300 mark, or its highest level since February 16. The pair, however, manages to rebound a few pips from the daily low and trades around the 0.6230 region during the early European session, still down nearly 0.50% for the day.
The US Dollar (USD) strengthens across the board amid fresh bets for further policy tightening by the Federal Reserve (Fed) and turns out to be a key factor weighing on the NZD/USD pair. Crude Oil prices rise sharply following a surprise production cut by the OPEC+ and fuel inflation fears, which might force the Federal Reserve to move back to its inflation-fighting rate hikes. In fact, the markets are now pricing in a greater possibility of a 25 bps lift-off at the next FOMC policy meeting in May. This pushes the US Treasury bond yields higher and acts as a tailwind for the Greenback.
That said, a stable performance around the equity markets acts as a headwind for the safe-haven buck and lends support to the risk-sensitive Kiwi, at least for the time being. Any optimism in the markets, however, is likely to be short-lived amid concerns about a deeper global economic downturn. The worries resurfaced after data out of Asia showed that manufacturing activity in Japan contracted during March, while growth in China stalled during the reported month. This might hold back traders from placing bullish bets around the NZD/USD pair and positioning for any meaningful upside.
Even from a technical perspective, the recent repeated failures to find acceptance above the very important 200-day Simple Moving Average (SMA) warrants some caution for bullish traders. Market participants now look to the US ISM Manufacturing PMI for some impetus later during the early North American session. This week’s rather busy economic docket also features the Reserve Bank of New Zealand (RBNZ) monetary policy meeting on Wednesday and the US monthly employment data, or the NFP report on Friday, which will help determine the near-term trajectory for the NZD/USD pair.
Technical Levels: Supports and Resistances
NZDUSD currently trading at 0.6229 at the time of writing. Pair opened at 0.6261 and is trading with a change of -0.51 % .
| Overview | Overview.1 | |
|---|---|---|
| 0 | Today last price | 0.6229 |
| 1 | Today Daily Change | -0.0032 |
| 2 | Today Daily Change % | -0.5100 |
| 3 | Today daily open | 0.6261 |
The pair is trading above its 20 Daily moving average @ 0.6204, below its 50 Daily moving average @ 0.6279 , below its 100 Daily moving average @ 0.6295 and above its 200 Daily moving average @ 0.6159
| Trends | Trends.1 | |
|---|---|---|
| 0 | Daily SMA20 | 0.6204 |
| 1 | Daily SMA50 | 0.6279 |
| 2 | Daily SMA100 | 0.6295 |
| 3 | Daily SMA200 | 0.6159 |
The previous day high was 0.6298 while the previous day low was 0.6237. The daily 38.2% Fib levels comes at 0.6261, expected to provide resistance. Similarly, the daily 61.8% fib level is at 0.6275, expected to provide resistance.
Note the levels of interest below:
- Pivot support is noted at 0.6233, 0.6205, 0.6173
- Pivot resistance is noted at 0.6294, 0.6326, 0.6354
| Levels | Levels.1 |
|---|---|
| Previous Daily High | 0.6298 |
| Previous Daily Low | 0.6237 |
| Previous Weekly High | 0.6298 |
| Previous Weekly Low | 0.6180 |
| Previous Monthly High | 0.6298 |
| Previous Monthly Low | 0.6084 |
| Daily Fibonacci 38.2% | 0.6261 |
| Daily Fibonacci 61.8% | 0.6275 |
| Daily Pivot Point S1 | 0.6233 |
| Daily Pivot Point S2 | 0.6205 |
| Daily Pivot Point S3 | 0.6173 |
| Daily Pivot Point R1 | 0.6294 |
| Daily Pivot Point R2 | 0.6326 |
| Daily Pivot Point R3 | 0.6354 |
[/s2If]
Join Our Telegram Group


