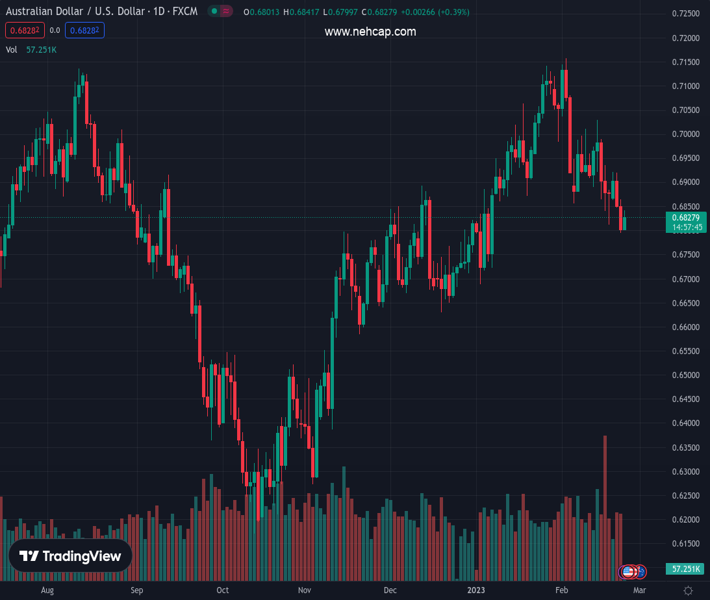
#AUDUSD @ 0.68276 picks up bids to defend the bounce off key DMA, pokes five-week-old previous support., @nehcap view: Bearish (Pivot Orderbook analysis)
…
This is a premium post.
[s2If !current_user_can(access_s2member_level4)]Please register for PREMIUM VERSION HERE to read full post below containing analysis. In case of any error or you think you are not able to read the full post below, please email us at support#nehcap.com [lwa][/s2If] [s2If current_user_can(access_s2member_level4)]
- AUD/USD picks up bids to defend the bounce off key DMA, pokes five-week-old previous support.
- Bearish MACD signals, downbeat RSI keeps sellers hopeful.
- Buyers need to cross 0.6975 to retake control.
The pair currently trades last at 0.68276.
The previous day high was 0.6865 while the previous day low was 0.6795. The daily 38.2% Fib levels comes at 0.6822, expected to provide support. Similarly, the daily 61.8% fib level is at 0.6838, expected to provide resistance.
AUD/USD holds onto the day-start rebound from a seven-week low as bulls attack the previous support line near 0.6835 during early Thursday morning in Europe. In doing so, the Aussie pair defends the bounce off the 200-DMA to print the first daily gains in three.
It’s worth noting, however, that the recovery remains elusive amid bearish MACD signals and the downbeat RSI (14). Adding strength to the downside bias is the AUD/USD pair’s sustained trading beneath the support-turned-resistance line from late December 2022.
That said, the AUD/USD bears are on the watch and waiting for a clear break of the 200-DMA, around 0.6800 at the latest, to initiate fresh short positions.
Following that, a slump toward the previous monthly low surrounding 0.6685 can’t be ruled out.
However, the last December’s bottom surrounding 0.6630 could challenge the AUD/USD bears afterward.
On the flip side, a daily closing beyond the immediate hurdle, namely the support-turned-resistance line of 0.6835-40, can challenge the weekly high of 0.6920.
Even so, the upside momentum remains unclear before the AUD/USD crosses a bit longer previous support line, close to 0.6970 at the latest.
Also acting as an upside hurdle is the 0.7000 threshold and the mid-February swing high near 0.7030.
Overall, AUD/USD rebound remains unimpressive as bears keep the reins.
Trend: Bearish
Technical Levels: Supports and Resistances
AUDUSD currently trading at 0.6835 at the time of writing. Pair opened at 0.6805 and is trading with a change of 0.44% % .
| Overview | Overview.1 | |
|---|---|---|
| 0 | Today last price | 0.6835 |
| 1 | Today Daily Change | 0.0030 |
| 2 | Today Daily Change % | 0.44% |
| 3 | Today daily open | 0.6805 |
The pair is trading below its 20 Daily moving average @ 0.6965, below its 50 Daily moving average @ 0.689 , above its 100 Daily moving average @ 0.6718 and above its 200 Daily moving average @ 0.6804
| Trends | Trends.1 | |
|---|---|---|
| 0 | Daily SMA20 | 0.6965 |
| 1 | Daily SMA50 | 0.6890 |
| 2 | Daily SMA100 | 0.6718 |
| 3 | Daily SMA200 | 0.6804 |
The previous day high was 0.6865 while the previous day low was 0.6795. The daily 38.2% Fib levels comes at 0.6822, expected to provide support. Similarly, the daily 61.8% fib level is at 0.6838, expected to provide resistance.
Note the levels of interest below:
- Pivot support is noted at 0.6778, 0.6752, 0.6708
- Pivot resistance is noted at 0.6848, 0.6891, 0.6918
| Levels | Levels.1 |
|---|---|
| Previous Daily High | 0.6865 |
| Previous Daily Low | 0.6795 |
| Previous Weekly High | 0.7030 |
| Previous Weekly Low | 0.6812 |
| Previous Monthly High | 0.7143 |
| Previous Monthly Low | 0.6688 |
| Daily Fibonacci 38.2% | 0.6822 |
| Daily Fibonacci 61.8% | 0.6838 |
| Daily Pivot Point S1 | 0.6778 |
| Daily Pivot Point S2 | 0.6752 |
| Daily Pivot Point S3 | 0.6708 |
| Daily Pivot Point R1 | 0.6848 |
| Daily Pivot Point R2 | 0.6891 |
| Daily Pivot Point R3 | 0.6918 |
[/s2If]
Join Our Telegram Group
")


