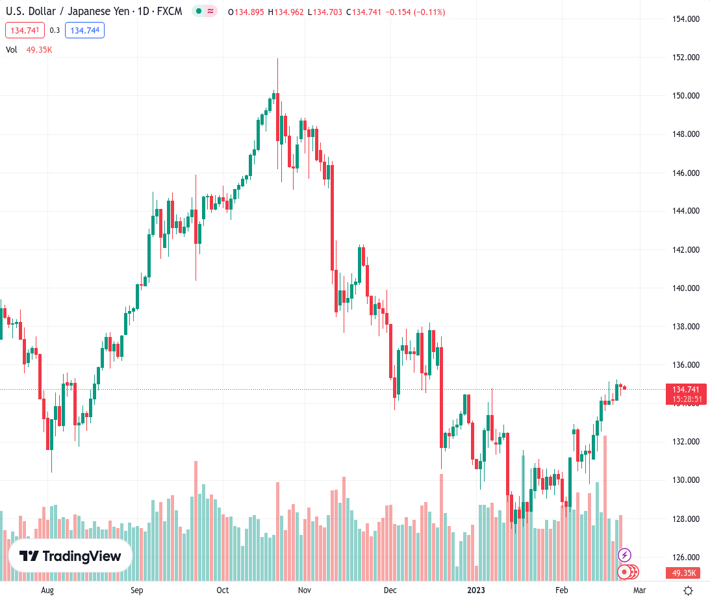
#USDJPY @ 134.767 fades bounce off intraday low, prints mild losses to snap four-day uptrend. (Pivot Orderbook analysis)
…
This is a premium post.
[s2If !current_user_can(access_s2member_level4)]Please register for PREMIUM VERSION HERE to read full post below containing analysis. In case of any error or you think you are not able to read the full post below, please email us at support#nehcap.com [lwa][/s2If] [s2If current_user_can(access_s2member_level4)]
- USD/JPY fades bounce off intraday low, prints mild losses to snap four-day uptrend.
- Treasury bond yields remain lackluster on Japan holiday.
- Retreat in US inflation expectations joins mixed geopolitical, Fed headlines to probe momentum traders.
The pair currently trades last at 134.767.
The previous day high was 135.06 while the previous day low was 134.37. The daily 38.2% Fib levels comes at 134.8, expected to provide resistance. Similarly, the daily 61.8% fib level is at 134.63, expected to provide support.
USD/JPY retreats to 134.80 as bears appear determined to retake control, after a four-day absence, during early Thursday. Even so, Japan’s holiday and hawkish Fed concerns join geopolitical fears to challenge the downside momentum. As a result, the yen pair prints mild losses during the first downbeat day in five.
Starting with the Yen positive headlines, the retreat in the US Treasury bond yields and inflation expectations, per the 10-year and 5-year breakeven inflation rates from the St. Louis Federal Reserve (FRED), seem to exert downside pressure on the USD/JPY price.
On the same line are the receding fears of nuclear war as US President Joe Biden thinks that his Russian counterpart isn’t up to using nuclear arms by backing off an international treaty.
Furthermore, hawkish concerns surrounding the Bank of Japan (BoJ), due to the nearness to the end of Governor Haruhiko Kuroda’s term, also weigh on the USD/JPY pair.
Alternatively, Fed policymakers are all in for further rate lifts, per the latest Federal Open Market Committee’s (FOMC) Monetary Policy Meeting Minutes, which in turn propels the US Dollar demand. Further, the fears surrounding the Ukraine-Russia war are far from over, with the latest edition of the West and China escalating the matter to the worse.
Amid these plays, S&P 500 Futures bounced off the monthly low to print mild gains around 4,010 whereas the Treasury bond yields remain sidelined amid off in Japan. That said, the US Dollar Index (DXY) drops 0.20% to 104.35 by the press time.
Looking ahead, a lack of major data/events could restrict USD/JPY moves but central bankers’ speeches can entertain the pair traders ahead of Friday’s US Core Personal Consumption Expenditures (PCE) Price Index data, the Fed’s favorite inflation gauge. Also important to watch will be the geopolitical headlines surrounding Russia, China and the US.
Wednesday’s Doji candlestick joins overbought RSI on the daily chart to challenge USD/JPY bulls.
Technical Levels: Supports and Resistances
USDJPY currently trading at 134.79 at the time of writing. Pair opened at 134.94 and is trading with a change of -0.11% % .
| Overview | Overview.1 | |
|---|---|---|
| 0 | Today last price | 134.79 |
| 1 | Today Daily Change | -0.15 |
| 2 | Today Daily Change % | -0.11% |
| 3 | Today daily open | 134.94 |
The pair is trading above its 20 Daily moving average @ 131.96, above its 50 Daily moving average @ 131.86 , below its 100 Daily moving average @ 137.36 and below its 200 Daily moving average @ 137.01
| Trends | Trends.1 | |
|---|---|---|
| 0 | Daily SMA20 | 131.96 |
| 1 | Daily SMA50 | 131.86 |
| 2 | Daily SMA100 | 137.36 |
| 3 | Daily SMA200 | 137.01 |
The previous day high was 135.06 while the previous day low was 134.37. The daily 38.2% Fib levels comes at 134.8, expected to provide resistance. Similarly, the daily 61.8% fib level is at 134.63, expected to provide support.
Note the levels of interest below:
- Pivot support is noted at 134.52, 134.1, 133.83
- Pivot resistance is noted at 135.21, 135.48, 135.91
| Levels | Levels.1 |
|---|---|
| Previous Daily High | 135.06 |
| Previous Daily Low | 134.37 |
| Previous Weekly High | 135.11 |
| Previous Weekly Low | 131.27 |
| Previous Monthly High | 134.78 |
| Previous Monthly Low | 127.22 |
| Daily Fibonacci 38.2% | 134.80 |
| Daily Fibonacci 61.8% | 134.63 |
| Daily Pivot Point S1 | 134.52 |
| Daily Pivot Point S2 | 134.10 |
| Daily Pivot Point S3 | 133.83 |
| Daily Pivot Point R1 | 135.21 |
| Daily Pivot Point R2 | 135.48 |
| Daily Pivot Point R3 | 135.91 |
[/s2If]
Join Our Telegram Group
")


