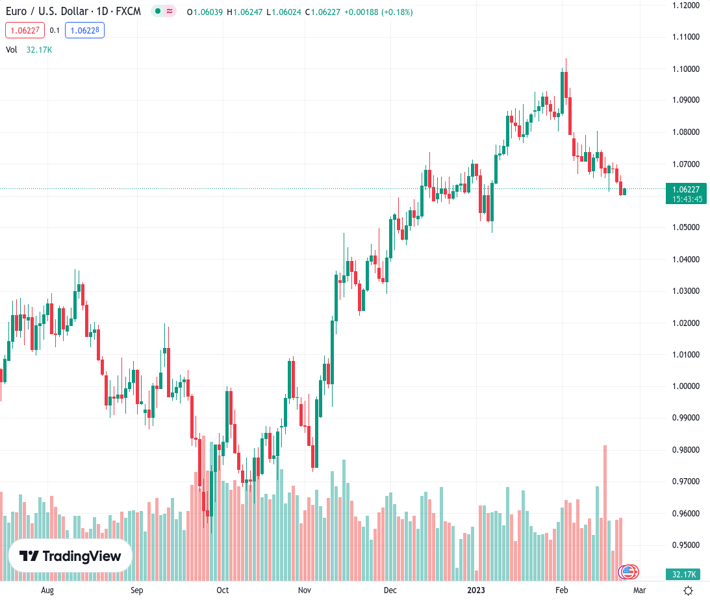
#EURUSD @ 1.06212 displayed a solid recovery from 1.0600 as investors underpinned the risk-on market mood. (Pivot Orderbook analysis)
…
This is a premium post.
[s2If !current_user_can(access_s2member_level4)]Please register for PREMIUM VERSION HERE to read full post below containing analysis. In case of any error or you think you are not able to read the full post below, please email us at support#nehcap.com [lwa][/s2If] [s2If current_user_can(access_s2member_level4)]
- EUR/USD displayed a solid recovery from 1.0600 as investors underpinned the risk-on market mood.
- The USD Index corrected as investors digested the hawkish Federal Reserve minutes.
- European Central Bank is eyeing a continuation of 50 bps rate hike spell.
- EUR/USD is auctioning in a Symmetrical Triangle that conveys volatility contraction.
The pair currently trades last at 1.06212.
The previous day high was 1.0664 while the previous day low was 1.0599. The daily 38.2% Fib levels comes at 1.0624, expected to provide resistance. Similarly, the daily 61.8% fib level is at 1.0639, expected to provide resistance.
EUR/USD has stretched its recovery above 1.0620 in the early European session as the risk-taking ability of the market participants has improved firmly. The major currency displayed a confident recovery move from the round-level support of 1.0600 as investors digested the uncertainty associated with the context of policy tightening continuation by the Federal Reserve (Fed) to tame sticky inflation.
S&P500 futures have shown sheer volatility in its recovery move after a rangebound Wednesday, portraying the risk-appetite theme. The positive market sentiment has resulted in a correction in the US Dollar Index (DXY) to near 104.00. At the time of writing, the USD Index is attempting a revival.
The market mood could dampen as geopolitical tensions have not eased yet. China’s top diplomat Wang Yi said on Wednesday that they are ready to deepen strategic cooperation with Russia, as reported by Reuters. He further added, “Our relations will not succumb to pressure from third countries.” Earlier, the US ambassador to the United Nations, Ambassador Linda Thomas-Greenfield, said China would cross a “red line” if the country decided to provide lethal military aid to Russia for its invasion of Ukraine.
The message from the Federal Open Market Committee (FOMC) minutes that the policy tightening spell will continue as a three-month decline in the United States Consumer Price Index (CPI) is insufficient to infuse confidence among the Federal Reserve policymakers that inflation will come down in an expected manner.
Federal Reserve chair Jerome Powell and other policymakers believe that the upbeat labor market and a recovery in the January Retail Sales data could trigger a revival in the US CPI ahead. The FOMC minutes conveyed that two policymakers Cleveland Fed President Loretta Mester and St. Louis Fed President James Bullard were not in favor of slicing the extent of the interest rate hikes again. In its December monetary policy meeting, the Federal Reserve trimmed the policy tightening pace to 50 basis points (bps) after hiking interest rates four times consecutively by 75 bps.
Talking about the external forces, the Federal Reserve believes that the rollback of pandemic controls by China and the ongoing Russia-Ukraine war could also accelerate the price index in the US.
In Eurozone, price pressures have fallen at a decent pace in the past few months after the continuous policy tightening by the European Central Bank (ECB). The central bank has already pushed interest rates to 3% in its February monetary policy meeting and further rate hike are on the table. No doubt, the price index is responding effectively to the restrictive monetary policy but a pause at this time could be a premature decision.
European Central Bank President Christine Lagarde in his speech on Tuesday announced that the central bank is ready to hike interest rates further by 50 bps to 3.50% in March. The economy has managed to dodge the recession in CY2022 and now a decent recovery in Eurozone makes the decision of further rate hikes more constructive.
Meanwhile, Goldman Sachs has come forward with an interest rate projection for the European Central Bank. The investment banking firm said in addition to an increase of 50 basis points in March and 25 basis points in May, it was estimating a 25 basis-point hike in June.
EUR/USD is continuously facing barricades around the 61.8% Fibonacci retracement (placed from January 6 low at 1.0483 to February high at 1.1033) at 1.0693. The formation of the Symmetrical Triangle chart pattern is indicating a volatility contraction in the asset.
The 20-period Exponential Moving Average (EMA) at 1.0633 is overlapping with the asset price, which indicates a rangebound performance ahead.
Meanwhile, the Relative Strength Index (RSI) (14) has not slipped confidently into the bearish range of 20.00-40.00 yet. Therefore, a bearish momentum has not been activated yet.
Technical Levels: Supports and Resistances
EURUSD currently trading at 1.0622 at the time of writing. Pair opened at 1.0603 and is trading with a change of 0.18 % .
| Overview | Overview.1 | |
|---|---|---|
| 0 | Today last price | 1.0622 |
| 1 | Today Daily Change | 0.0019 |
| 2 | Today Daily Change % | 0.1800 |
| 3 | Today daily open | 1.0603 |
The pair is trading below its 20 Daily moving average @ 1.076, below its 50 Daily moving average @ 1.0727 , above its 100 Daily moving average @ 1.0435 and above its 200 Daily moving average @ 1.0331
| Trends | Trends.1 | |
|---|---|---|
| 0 | Daily SMA20 | 1.0760 |
| 1 | Daily SMA50 | 1.0727 |
| 2 | Daily SMA100 | 1.0435 |
| 3 | Daily SMA200 | 1.0331 |
The previous day high was 1.0664 while the previous day low was 1.0599. The daily 38.2% Fib levels comes at 1.0624, expected to provide resistance. Similarly, the daily 61.8% fib level is at 1.0639, expected to provide resistance.
Note the levels of interest below:
- Pivot support is noted at 1.058, 1.0557, 1.0515
- Pivot resistance is noted at 1.0645, 1.0687, 1.071
| Levels | Levels.1 |
|---|---|
| Previous Daily High | 1.0664 |
| Previous Daily Low | 1.0599 |
| Previous Weekly High | 1.0805 |
| Previous Weekly Low | 1.0613 |
| Previous Monthly High | 1.0930 |
| Previous Monthly Low | 1.0483 |
| Daily Fibonacci 38.2% | 1.0624 |
| Daily Fibonacci 61.8% | 1.0639 |
| Daily Pivot Point S1 | 1.0580 |
| Daily Pivot Point S2 | 1.0557 |
| Daily Pivot Point S3 | 1.0515 |
| Daily Pivot Point R1 | 1.0645 |
| Daily Pivot Point R2 | 1.0687 |
| Daily Pivot Point R3 | 1.0710 |
[/s2If]
Join Our Telegram Group
")


