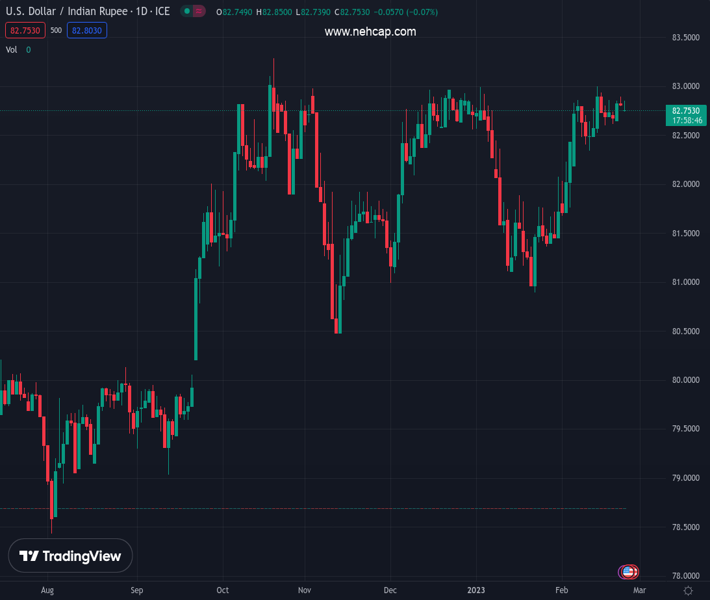
#USDINR @ 82.7730 is displaying wild moves as investors are discounting the impact of the release of the overnight FOMC minutes. (Pivot Orderbook analysis)
…
This is a premium post.
[s2If !current_user_can(access_s2member_level4)]Please register for PREMIUM VERSION HERE to read full post below containing analysis. In case of any error or you think you are not able to read the full post below, please email us at support#nehcap.com [lwa][/s2If] [s2If current_user_can(access_s2member_level4)]
- USD/INR is displaying wild moves as investors are discounting the impact of the release of the overnight FOMC minutes.
- Fed policymakers are favoring the continuation of policy tightening to avoid fears of a recovery in US inflation.
- The asset is testing the breakout of the Descending Triangle chart pattern around 82.70.
The pair currently trades last at 82.7730.
The previous day high was 82.998 while the previous day low was 82.7895. The daily 38.2% Fib levels comes at 82.9184, expected to provide resistance. Similarly, the daily 61.8% fib level is at 82.8691, expected to provide resistance.
The USD/INR pair is displaying wild moves in the opening session as investors are discounting the impact of the release of the hawkish Federal Open Market Committee (FOMC) minutes.
According to the FOMC minutes, Federal Reserve (Fed) policymakers were loud and clear that a strong labor market and upbeat January Monthly Sales are posing a threat of pause in the declining trend of the United States Consumer Price Index (CPI). Therefore, the Fed should reach to terminal rate to bring down inflation to the 2% target.
The US Dollar Index (DXY) has dropped to near 104.00 after printing a three-day high of 104.20 as the risk aversion theme has eased. S&P500 futures have added significant gains in the Asian session, portraying a sheer recovery in the risk appetite of the market participants.
USD/INR is testing the breakout of the Descending Triangle chart pattern on an hourly scale. A breakout of the aforementioned chart pattern results in a volatility expansion after a sheer contraction. The downward-sloping trendline of the triangle is plotted from February 14 high at 83.04 while the horizontal support is placed from February 14 low at 82.57.
The mighty 200-period Exponential Moving Average (EMA) at 82.73 is providing support to the US Dollar bulls.
Meanwhile, the Relative Strength Index (RSI) (14) is looking for a cushion around 40.00 after a healthy correction.
Should the asset break above February 22 high at around 83.00, US Dollar bulls will drive the asset toward October 23 high at 83.29. A breach of the latter will expose the asset to unchartered territory. The asset might find further resistance around 83.50, being a round-level number.
On the flip side, a break below February 14 low at 82.57 will drag the asset toward February 10 low at 82.33 followed by January 31 high at 82.07.
Technical Levels: Supports and Resistances
USDINR currently trading at 82.771 at the time of writing. Pair opened at 82.876 and is trading with a change of -0.13 % .
| Overview | Overview.1 | |
|---|---|---|
| 0 | Today last price | 82.771 |
| 1 | Today Daily Change | -0.105 |
| 2 | Today Daily Change % | -0.130 |
| 3 | Today daily open | 82.876 |
The pair remains strongly bullish on the daily timeframe. It trades above its 20 SMA @ 82.4098, 50 SMA 82.2707, 100 SMA @ 82.1479 and 200 SMA @ 80.7064.
| Trends | Trends.1 | |
|---|---|---|
| 0 | Daily SMA20 | 82.4098 |
| 1 | Daily SMA50 | 82.2707 |
| 2 | Daily SMA100 | 82.1479 |
| 3 | Daily SMA200 | 80.7064 |
The previous day high was 82.998 while the previous day low was 82.7895. The daily 38.2% Fib levels comes at 82.9184, expected to provide resistance. Similarly, the daily 61.8% fib level is at 82.8691, expected to provide resistance.
Note the levels of interest below:
- Pivot support is noted at 82.7777, 82.6793, 82.5692
- Pivot resistance is noted at 82.9862, 83.0963, 83.1947
| Levels | Levels.1 |
|---|---|
| Previous Daily High | 82.9980 |
| Previous Daily Low | 82.7895 |
| Previous Weekly High | 83.0456 |
| Previous Weekly Low | 82.4892 |
| Previous Monthly High | 83.0720 |
| Previous Monthly Low | 80.8822 |
| Daily Fibonacci 38.2% | 82.9184 |
| Daily Fibonacci 61.8% | 82.8691 |
| Daily Pivot Point S1 | 82.7777 |
| Daily Pivot Point S2 | 82.6793 |
| Daily Pivot Point S3 | 82.5692 |
| Daily Pivot Point R1 | 82.9862 |
| Daily Pivot Point R2 | 83.0963 |
| Daily Pivot Point R3 | 83.1947 |
[/s2If]
Join Our Telegram Group
")


