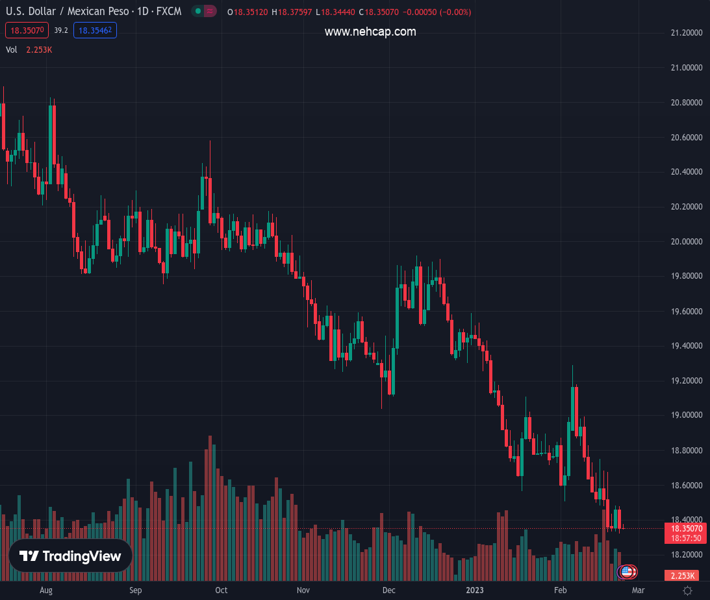
#USDMXN @ 18.3515 grinds near the lowest levels since April 2018., @nehcap view: Further downside expected (Pivot Orderbook analysis)
…
This is a premium post.
[s2If !current_user_can(access_s2member_level4)]Please register for PREMIUM VERSION HERE to read full post below containing analysis. In case of any error or you think you are not able to read the full post below, please email us at support#nehcap.com [lwa][/s2If] [s2If current_user_can(access_s2member_level4)]
- USD/MXN grinds near the lowest levels since April 2018.
- Nearly oversold RSI conditions challenge bears on their way to three-month-old support line.
- Two-week-long descending trend line challenges bulls before $18.50 resistance confluence.
- Sustained trading below the key trend line, moving average joins bearish MACD signals to favor sellers.
The pair currently trades last at 18.3515.
The previous day high was 18.4804 while the previous day low was 18.3209. The daily 38.2% Fib levels comes at 18.3819, expected to provide resistance. Similarly, the daily 61.8% fib level is at 18.4195, expected to provide resistance.
USD/MXN bears take a breather around $18.40 during early Thursday, following a slump to a nearly five-year low the previous day.
In doing so, the Mexican Peso (MXN) pair takes clues from the RSI (14) conditions to probe the sellers. However, bearish MACD signals and the quote’s sustained trading below the previous support line from early February, as well as the 10-DMA, keep the bears hopeful.
That said, the latest multi-month low near $18.30 appears immediate support for the USD/MXN bears to watch during the quote’s fresh downside.
Following that, a descending support line from late November 2022, close to $18.20 by the press time, will be crucial to challenge the pair’s further declines.
In a case where USD/MXN remains bearish past $18.20, the April 2018 low near the $18.00 threshold should lure the sellers.
On the contrary, recovery moves may initially aim for the fortnight-old resistance line, close to $18.40 by the press time.
Following that, a convergence of the 10-DMA and the support-turned-resistance line from February 02, close to $18.50, will be crucial to watch before welcoming the buyers.
Trend: Further downside expected
Technical Levels: Supports and Resistances
USDMXN currently trading at 18.3634 at the time of writing. Pair opened at 18.3745 and is trading with a change of -0.06% % .
| Overview | Overview.1 | |
|---|---|---|
| 0 | Today last price | 18.3634 |
| 1 | Today Daily Change | -0.0111 |
| 2 | Today Daily Change % | -0.06% |
| 3 | Today daily open | 18.3745 |
The pair remains strongly bearish on the daily time frame. It trades below the 20 SMA @ 18.6809, 50 SMA 19.0134, 100 SMA @ 19.3411 and 200 SMA @ 19.7368.
| Trends | Trends.1 | |
|---|---|---|
| 0 | Daily SMA20 | 18.6809 |
| 1 | Daily SMA50 | 19.0134 |
| 2 | Daily SMA100 | 19.3411 |
| 3 | Daily SMA200 | 19.7368 |
The previous day high was 18.4804 while the previous day low was 18.3209. The daily 38.2% Fib levels comes at 18.3819, expected to provide resistance. Similarly, the daily 61.8% fib level is at 18.4195, expected to provide resistance.
Note the levels of interest below:
- Pivot support is noted at 18.3035, 18.2325, 18.144
- Pivot resistance is noted at 18.463, 18.5515, 18.6225
| Levels | Levels.1 |
|---|---|
| Previous Daily High | 18.4804 |
| Previous Daily Low | 18.3209 |
| Previous Weekly High | 18.7540 |
| Previous Weekly Low | 18.3306 |
| Previous Monthly High | 19.5361 |
| Previous Monthly Low | 18.5663 |
| Daily Fibonacci 38.2% | 18.3819 |
| Daily Fibonacci 61.8% | 18.4195 |
| Daily Pivot Point S1 | 18.3035 |
| Daily Pivot Point S2 | 18.2325 |
| Daily Pivot Point S3 | 18.1440 |
| Daily Pivot Point R1 | 18.4630 |
| Daily Pivot Point R2 | 18.5515 |
| Daily Pivot Point R3 | 18.6225 |
[/s2If]
Join Our Telegram Group
")


