#GBPUSD @ 1.20591 picks up bids to refresh intraday high, pares biggest daily loss in over a week., @nehcap view: Further recovery expected (Pivot Orderbook analysis)
…
This is a premium post.
[s2If !current_user_can(access_s2member_level4)]Please register for PREMIUM VERSION HERE to read full post below containing analysis. In case of any error or you think you are not able to read the full post below, please email us at support#nehcap.com [lwa][/s2If] [s2If current_user_can(access_s2member_level4)]
- GBP/USD picks up bids to refresh intraday high, pares biggest daily loss in over a week.
- One-week-old ascending trend line joins hidden bullish RSI divergence to favor Cable buyers.
- 200-EMA appears important challenge for bulls, six-week-old support line can lure bears past 1.2040.
The pair currently trades last at 1.20591.
The previous day high was 1.2135 while the previous day low was 1.2035. The daily 38.2% Fib levels comes at 1.2073, expected to provide resistance. Similarly, the daily 61.8% fib level is at 1.2097, expected to provide resistance.
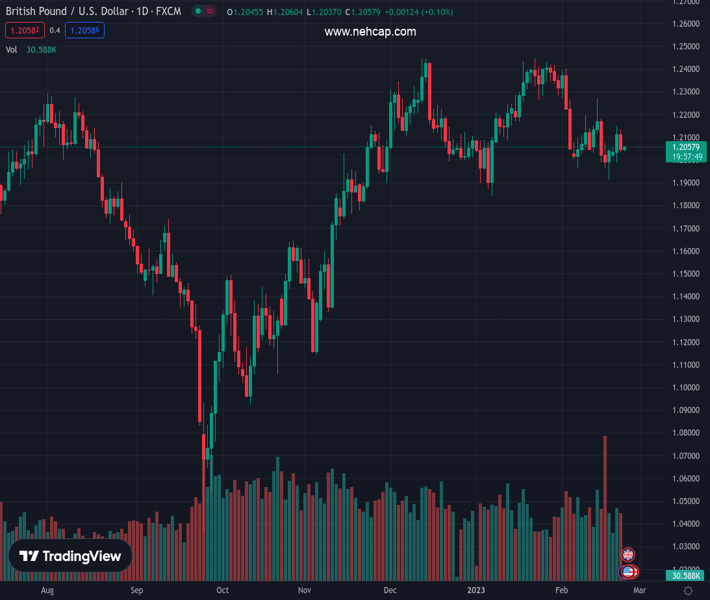
GBP/USD renews its intraday high near 1.2060 as it consolidates the biggest daily loss in more than a during early Thursday. In doing so, the Cable pair rebounds from a one-week-long ascending trend amid hidden bullish RSI divergence.
That said, the RSI (14) prints lower lows but the GBP/USD price prints higher lows, which in turn portrays a hidden bullish divergence and favors the quote’s latest bounce off the short-term key support line.
However, the 61.8% Fibonacci retracement level of the pair’s January 2023 up-moves, near 1.2075, acts as a validation point for the pair’s further upside.
Following that, the 200-bar Exponential Moving Average (EMA) level surrounding 1.2135 could challenge the GBP/USD bulls before directing them to the previous weekly high of near 1.2270.
In a case where the Cable pair remains firmer past 1.2270, January’s top around 1.2450 will be in the spotlight.
Alternatively, a downside break of the immediate support line, close to 1.2040 by the press time, could quickly recall the 1.2000 psychological magnet on the chart.
However, a descending support line from January 12, 2023, around 1.1900 at the latest, could probe the GBP/USD bears afterward.
Trend: Further recovery expected
Technical Levels: Supports and Resistances
GBPUSD currently trading at 1.2056 at the time of writing. Pair opened at 1.2043 and is trading with a change of 0.11% % .
| Overview | Overview.1 | |
|---|---|---|
| 0 | Today last price | 1.2056 |
| 1 | Today Daily Change | 0.0013 |
| 2 | Today Daily Change % | 0.11% |
| 3 | Today daily open | 1.2043 |
The pair is trading below its 20 Daily moving average @ 1.2151, below its 50 Daily moving average @ 1.2156 , above its 100 Daily moving average @ 1.1923 and above its 200 Daily moving average @ 1.1935
| Trends | Trends.1 | |
|---|---|---|
| 0 | Daily SMA20 | 1.2151 |
| 1 | Daily SMA50 | 1.2156 |
| 2 | Daily SMA100 | 1.1923 |
| 3 | Daily SMA200 | 1.1935 |
The previous day high was 1.2135 while the previous day low was 1.2035. The daily 38.2% Fib levels comes at 1.2073, expected to provide resistance. Similarly, the daily 61.8% fib level is at 1.2097, expected to provide resistance.
Note the levels of interest below:
- Pivot support is noted at 1.2007, 1.197, 1.1906
- Pivot resistance is noted at 1.2108, 1.2172, 1.2209
| Levels | Levels.1 |
|---|---|
| Previous Daily High | 1.2135 |
| Previous Daily Low | 1.2035 |
| Previous Weekly High | 1.2270 |
| Previous Weekly Low | 1.1915 |
| Previous Monthly High | 1.2448 |
| Previous Monthly Low | 1.1841 |
| Daily Fibonacci 38.2% | 1.2073 |
| Daily Fibonacci 61.8% | 1.2097 |
| Daily Pivot Point S1 | 1.2007 |
| Daily Pivot Point S2 | 1.1970 |
| Daily Pivot Point S3 | 1.1906 |
| Daily Pivot Point R1 | 1.2108 |
| Daily Pivot Point R2 | 1.2172 |
| Daily Pivot Point R3 | 1.2209 |
[/s2If]
Join Our Telegram Group
")


