#XAGUSD @ 21.499 Silver price remains sluggish after posting the biggest daily loss in two weeks., @nehcap view: Further downside expected (Pivot Orderbook analysis)
…
This is a premium post.
[s2If !current_user_can(access_s2member_level4)]Please register for PREMIUM VERSION HERE to read full post below containing analysis. In case of any error or you think you are not able to read the full post below, please email us at support#nehcap.com [lwa][/s2If] [s2If current_user_can(access_s2member_level4)]
- Silver price remains sluggish after posting the biggest daily loss in two weeks.
- Clear U-turn from 100-DMA, bearish MACD signals favor XAG/USD sellers.
- Buyers need daily closing beyond $22.60 to retake control.
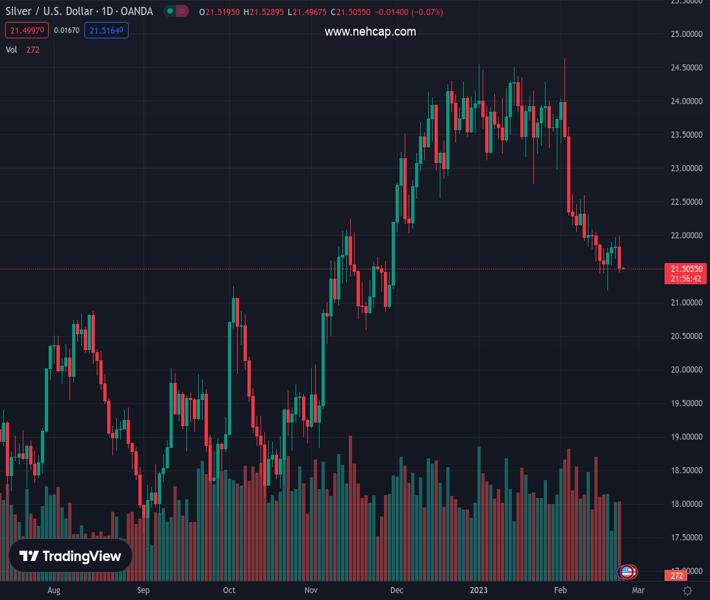
The pair currently trades last at 21.499.
The previous day high was 21.98 while the previous day low was 21.65. The daily 38.2% Fib levels comes at 21.85, expected to provide resistance. Similarly, the daily 61.8% fib level is at 21.77, expected to provide resistance.
Silver price (XAG/USD) struggles for clear directions at the weekly low surrounding $21.50 during early Thursday, after posting the biggest daily slump in a fortnight.
Although the early hours of the day restrict the metal’s moves, the XAG/USD remains on the bear’s radar while observing the previous day’s clear U-turn from the 100-DMA hurdle. Adding strength to the downside bias are the bearish MACD signals.
As a result, the Silver price is well-set to test the 200-DMA support of $21.00. However, the 50% Fibonacci retracement level of the metal’s upside from October 2022 to February 2023, around $21.35 will precede the latest swing low near $21.20 to probe the immediate downside.
In a case where the Silver bears dominate past 200-DMA, the 61.8% Fibonacci retracement level around $20.60, also known as the golden Fibonacci ratio, could act as an intermediate halt during the quote’s likely fall toward the $20.00 psychological magnet.
On the flip side, the Silver buyers are less likely to get convinced even if the metal offers a daily closing beyond the 100-DMA hurdle of $22.00.
That said, the 38.2% Fibonacci retracement and an 11-week-old horizontal resistance area, respectively near $22.15 and $22.55-60, could act as the last defense of the XAG/USD bears.
Overall, the Silver price is likely to remain bearish despite the latest inaction.
Trend: Further downside expected
Technical Levels: Supports and Resistances
XAGUSD currently trading at 21.52 at the time of writing. Pair opened at 21.84 and is trading with a change of -1.47 % .
| Overview | Overview.1 | |
|---|---|---|
| 0 | Today last price | 21.52 |
| 1 | Today Daily Change | -0.32 |
| 2 | Today Daily Change % | -1.47 |
| 3 | Today daily open | 21.84 |
The pair is trading below its 20 Daily moving average @ 22.59, below its 50 Daily moving average @ 23.27 , below its 100 Daily moving average @ 22.0 and above its 200 Daily moving average @ 21.02
| Trends | Trends.1 | |
|---|---|---|
| 0 | Daily SMA20 | 22.59 |
| 1 | Daily SMA50 | 23.27 |
| 2 | Daily SMA100 | 22.00 |
| 3 | Daily SMA200 | 21.02 |
The previous day high was 21.98 while the previous day low was 21.65. The daily 38.2% Fib levels comes at 21.85, expected to provide resistance. Similarly, the daily 61.8% fib level is at 21.77, expected to provide resistance.
Note the levels of interest below:
- Pivot support is noted at 21.67, 21.49, 21.34
- Pivot resistance is noted at 22.0, 22.15, 22.33
| Levels | Levels.1 |
|---|---|
| Previous Daily High | 21.98 |
| Previous Daily Low | 21.65 |
| Previous Weekly High | 22.08 |
| Previous Weekly Low | 21.18 |
| Previous Monthly High | 24.55 |
| Previous Monthly Low | 22.76 |
| Daily Fibonacci 38.2% | 21.85 |
| Daily Fibonacci 61.8% | 21.77 |
| Daily Pivot Point S1 | 21.67 |
| Daily Pivot Point S2 | 21.49 |
| Daily Pivot Point S3 | 21.34 |
| Daily Pivot Point R1 | 22.00 |
| Daily Pivot Point R2 | 22.15 |
| Daily Pivot Point R3 | 22.33 |
[/s2If]
Join Our Telegram Group
")


