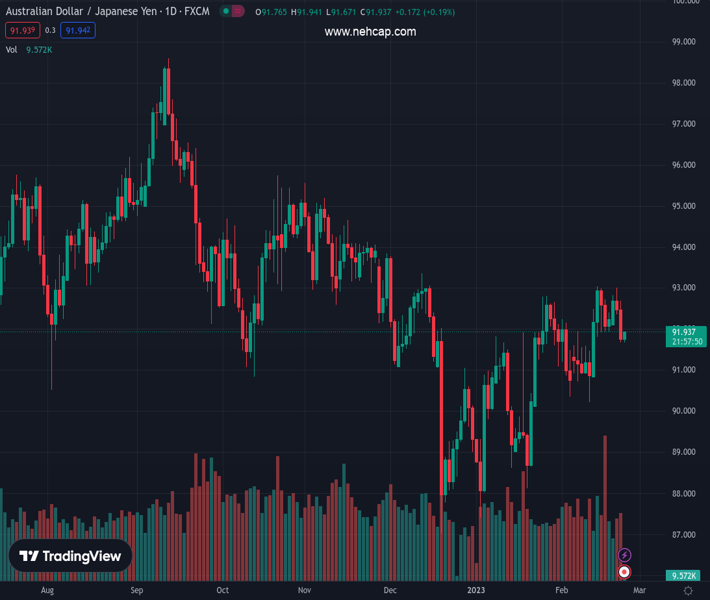
#AUDJPY @ 91.9400 The drops below the 100-day EMA and the 92.00 psychological figure. (Pivot Orderbook analysis)
…
This is a premium post.
[s2If !current_user_can(access_s2member_level4)]Please register for PREMIUM VERSION HERE to read full post below containing analysis. In case of any error or you think you are not able to read the full post below, please email us at support#nehcap.com [lwa][/s2If] [s2If current_user_can(access_s2member_level4)]
- The AUD/JPY drops below the 100-day EMA and the 92.00 psychological figure.
- AUD/JPY Price Analysis: Hits a new weekly low at 91.67, about to test the 200-DMA.
The pair currently trades last at 91.9400.
The previous day high was 93.01 while the previous day low was 92.37. The daily 38.2% Fib levels comes at 92.61, expected to provide resistance. Similarly, the daily 61.8% fib level is at 92.77, expected to provide resistance.
Due to a risk-off impulse, the AUD/JPY slides below the 20-day Exponential Moving Average (EMA), eyeing the intersection of the 200 and 50-day EMA at around 91.55/60. However, as the Asian session begins, the AUD/JPY is trading at 91.84, registering minuscule gains of 0.08%.
The AUD/JPY peaked during the week at around 93.01 on Tuesday and has enjoyed a downtrend of two straight days since then. The AUD/JPY failure to break above the last week’s high of 93.03 exacerbated a downfall of 120 pips or 1.30%. Oscillators like the Relative Strength Index (RSI) is neutral, while the Rate of Change (RoC) suggests that sellers are gaining momentum. Therefore, in the near term, the AUD/JPY might print a leg-down.
The AUD/JPY first support would be the 20-day EMA at 91.75. A breach of the latter will expose the confluence of the 200 and 50-day EMA at around 91.55/60, that once cleared, would pave the way toward 91.00. The sellers’ next stop would be the February 10 daily low of 90.22.
As an alternate scenario, the AUD/JPY first resistance would be the 92.00 figure. Once broken, the AUD/JPY will threaten the February 22 daily high at 92.68, followed by 93.00.
Technical Levels: Supports and Resistances
AUDJPY currently trading at 91.88 at the time of writing. Pair opened at 92.5 and is trading with a change of -0.67 % .
| Overview | Overview.1 | |
|---|---|---|
| 0 | Today last price | 91.88 |
| 1 | Today Daily Change | -0.62 |
| 2 | Today Daily Change % | -0.67 |
| 3 | Today daily open | 92.50 |
The pair is trading below its 20 Daily moving average @ 91.9, above its 50 Daily moving average @ 90.85 , below its 100 Daily moving average @ 92.15 and below its 200 Daily moving average @ 93.08
| Trends | Trends.1 | |
|---|---|---|
| 0 | Daily SMA20 | 91.90 |
| 1 | Daily SMA50 | 90.85 |
| 2 | Daily SMA100 | 92.15 |
| 3 | Daily SMA200 | 93.08 |
The previous day high was 93.01 while the previous day low was 92.37. The daily 38.2% Fib levels comes at 92.61, expected to provide resistance. Similarly, the daily 61.8% fib level is at 92.77, expected to provide resistance.
Note the levels of interest below:
- Pivot support is noted at 92.24, 91.98, 91.6
- Pivot resistance is noted at 92.88, 93.27, 93.52
| Levels | Levels.1 |
|---|---|
| Previous Daily High | 93.01 |
| Previous Daily Low | 92.37 |
| Previous Weekly High | 93.06 |
| Previous Weekly Low | 90.80 |
| Previous Monthly High | 92.82 |
| Previous Monthly Low | 87.41 |
| Daily Fibonacci 38.2% | 92.61 |
| Daily Fibonacci 61.8% | 92.77 |
| Daily Pivot Point S1 | 92.24 |
| Daily Pivot Point S2 | 91.98 |
| Daily Pivot Point S3 | 91.60 |
| Daily Pivot Point R1 | 92.88 |
| Daily Pivot Point R2 | 93.27 |
| Daily Pivot Point R3 | 93.52 |
[/s2If]
Join Our Telegram Group
")


