#USDCAD @ 1.35510 is looking to recapture the immediate resistance of 1.3550 amid a dismal market mood. (Pivot Orderbook analysis)
…
This is a premium post.
[s2If !current_user_can(access_s2member_level4)]Please register for PREMIUM VERSION HERE to read full post below containing analysis. In case of any error or you think you are not able to read the full post below, please email us at support#nehcap.com [lwa][/s2If] [s2If current_user_can(access_s2member_level4)]
- USD/CAD is looking to recapture the immediate resistance of 1.3550 amid a dismal market mood.
- An intense sell-off in the oil price after a heavy buildup of oil inventories reported by US API has impacted the Canadian Dollar.
- The RSI (14) is eyeing a break into the bullish range of 60.00-80.00 after a period of four months.
The pair currently trades last at 1.35510.
The previous day high was 1.3549 while the previous day low was 1.3441. The daily 38.2% Fib levels comes at 1.3508, expected to provide support. Similarly, the daily 61.8% fib level is at 1.3483, expected to provide support.
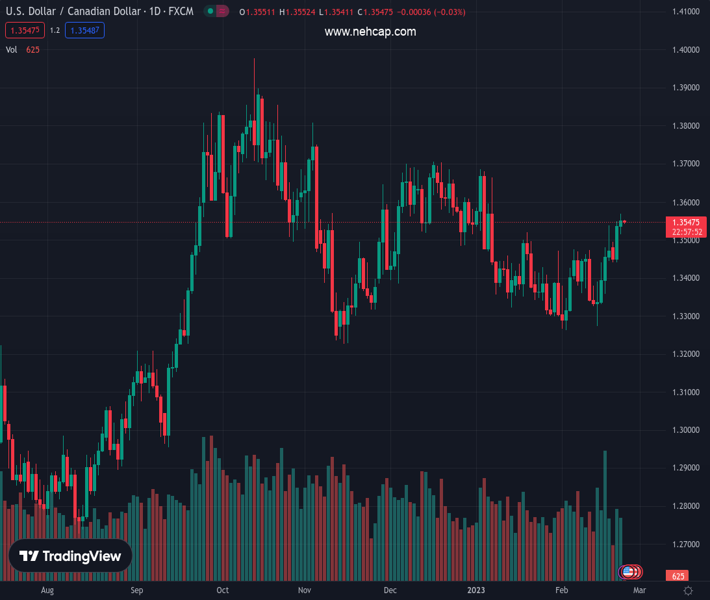
The USD/CAD pair is attempting to recapture the critical resistance of 1.3550 in the early Tokyo session. The Loonie asset witnessed a minor correction after a vertical upside move post hawkish Federal Open Market Committee (FOMC) minutes. The upside bias is still favored as the risk appetite of the market participants has weakened dramatically.
S&P500 futures are demonstrating marginal gains after a choppy trading session. The US Dollar Index (DXY) is aiming to test Friday’s high around 104.33 as investors have underpinned the risk-aversion theme.
Meanwhile, the oil price has refreshed its two-week low at $73.80 after the United States American Petroleum Institute (API) reported bumper oil stockpiles at 9.985 million barrels for the week ending February 17.
USD/CAD has overstepped the 61.8% Fibonacci retracement (placed from December 16 high at 1.3705 to February 2 low at 1.3262) at 1.3536 on a daily scale. The Loonie asset has also crossed the downward sloping trendline plotted from October 13 high at 1.3978, which indicates more upside ahead.
The 20-and 50-period Exponential Moving Averages (EMAs) are on the verge of delivering a bullish crossover at around 1.3445, which will be added to the upside filters.
Also, the Relative Strength Index (RSI) (14) is eyeing a break into the bullish range of 60.00-80.00 after a period of four months. An occurrence of the same will accelerate the upside momentum.
The Loonie asset might record more gains after surpassing February 22 high at 1.3568, which will drive the asset toward the round-level resistance at 1.3600 followed by November 29 high at 1.3645.
Alternatively, a break below February 6 high at 1.3474 will drag the asset to near 38.2% Fibo retracement at 1.3432. A slippage below the same will expose the asset to January 26 high of around 1.3408.
Technical Levels: Supports and Resistances
USDCAD currently trading at 1.3552 at the time of writing. Pair opened at 1.3537 and is trading with a change of 0.11 % .
| Overview | Overview.1 | |
|---|---|---|
| 0 | Today last price | 1.3552 |
| 1 | Today Daily Change | 0.0015 |
| 2 | Today Daily Change % | 0.1100 |
| 3 | Today daily open | 1.3537 |
The pair remains strongly bullish on the daily timeframe. It trades above its 20 SMA @ 1.339, 50 SMA 1.3466, 100 SMA @ 1.3516 and 200 SMA @ 1.3253.
| Trends | Trends.1 | |
|---|---|---|
| 0 | Daily SMA20 | 1.3390 |
| 1 | Daily SMA50 | 1.3466 |
| 2 | Daily SMA100 | 1.3516 |
| 3 | Daily SMA200 | 1.3253 |
The previous day high was 1.3549 while the previous day low was 1.3441. The daily 38.2% Fib levels comes at 1.3508, expected to provide support. Similarly, the daily 61.8% fib level is at 1.3483, expected to provide support.
Note the levels of interest below:
- Pivot support is noted at 1.3469, 1.3401, 1.3361
- Pivot resistance is noted at 1.3577, 1.3617, 1.3685
| Levels | Levels.1 |
|---|---|
| Previous Daily High | 1.3549 |
| Previous Daily Low | 1.3441 |
| Previous Weekly High | 1.3538 |
| Previous Weekly Low | 1.3274 |
| Previous Monthly High | 1.3685 |
| Previous Monthly Low | 1.3300 |
| Daily Fibonacci 38.2% | 1.3508 |
| Daily Fibonacci 61.8% | 1.3483 |
| Daily Pivot Point S1 | 1.3469 |
| Daily Pivot Point S2 | 1.3401 |
| Daily Pivot Point S3 | 1.3361 |
| Daily Pivot Point R1 | 1.3577 |
| Daily Pivot Point R2 | 1.3617 |
| Daily Pivot Point R3 | 1.3685 |
[/s2If]
Join Our Telegram Group
")


