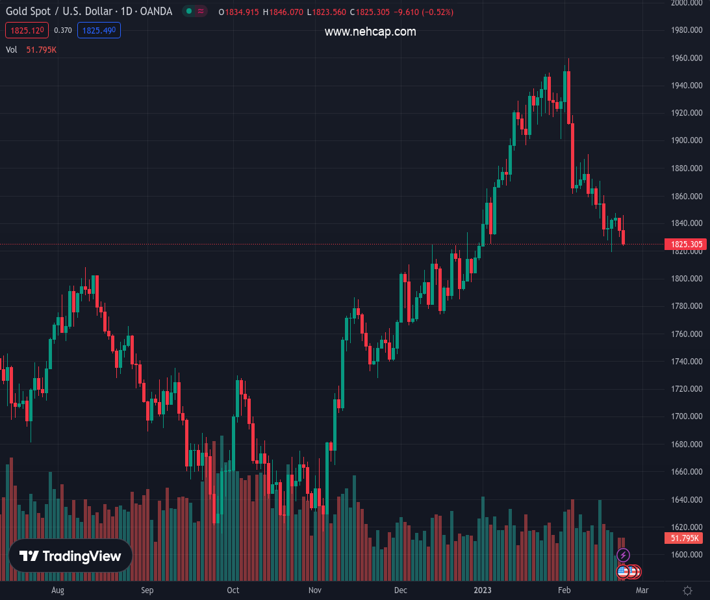
#XAUUSD @ 1,825.01 Gold price remains pressured around short-term key support after three-day downtrend., @nehcap view: Further downside expected (Pivot Orderbook analysis)
…
This is a premium post.
[s2If !current_user_can(access_s2member_level4)]Please register for PREMIUM VERSION HERE to read full post below containing analysis. In case of any error or you think you are not able to read the full post below, please email us at support#nehcap.com [lwa][/s2If] [s2If current_user_can(access_s2member_level4)]
- Gold price remains pressured around short-term key support after three-day downtrend.
- XAU/USD drops as Federal Reserve Minutes suggest policymakers discussed need of more rate hikes.
- Geopolitical fears, comments from Fed’s Bullard also weigh on Gold price.
- Gold sellers poke 100-day Exponential Moving Average support with eyes on United States statistics.
The pair currently trades last at 1825.01.
The previous day high was 1843.9 while the previous day low was 1830.3. The daily 38.2% Fib levels comes at 1835.5, expected to provide resistance. Similarly, the daily 61.8% fib level is at 1838.7, expected to provide resistance.
Gold price (XAU/USD) bears the burden of hawkish Federal Reserve (Fed) bias, as well as the geopolitical fears, as the yellow metal pokes a short-term key support surrounding $1,820 during early Thursday. In doing so, the XAU/USD also justifies the hawkish comments from a Fed Official while portraying the cautious mood ahead of the second-tier United States data amid firmer US Dollar.
As per the latest the Federal Open Market Committee’s (FOMC) Monetary Policy Meeting Minutes, all participants agreed more rate hikes are needed to achieve the inflation target while also favor further Fed balance sheet reductions. Adding strength to the hawkish Fed Minutes were statements suggesting that a few participants favored a 50 basis point (bps) rate hike, while some believed there was an elevated risk of a recession in 2023.
Given the hawkish Fed Minutes, the odds of sustained rate hikes are high, which in turn weigh on the Gold price, via firmer US Dollar and Treasury bond yields.
In line with the FOMC Minutes, St. Louis Federal Reserve President James Bullard also mentioned that the Fed will have to go north of 5% to tame inflation, as reported by Reuters. The policymaker also stated that he believes there are good chances they could beat inflation this year without creating a recession. The same suggests higher Fed rates for longer and exert downside pressure on the Gold price.
Elsewhere, geopolitical fears surrounding China and Russia escalated and favored the rush towards the risk-safety, which in turn propelled the US Dollar and weighed on the XAU/USD. The reason could be linked to the comments from China’s top diplomat Wang Yi who met Russian President Vladimir Putin and said that they are ready to deepen strategic cooperation with Russia on Wednesday, as reported by Reuters. The Chinese policymaker also added that their relations will not succumb to pressure from third countries. Meanwhile, Putin noted that it’s very important for them to have a cooperation with China and said he is looking forward Chinese President Xi Jinping to visit Moscow.
Following the hawkish Federal Reserve minutes, comments from Fed’s Bullard and geopolitical fears, the US Dollar Index (DXY) stretched their previous run-up to refresh the multi-day high and pleased the Gold sellers.
That said, the DXY refreshed the weekly high and approached the seven-week high marked in the mid-February. It should be noted, however, that the US 10-year and two-year Treasury bond yields retreat from their three-month high and Wall Street also closed mixed, which in turn should have put a floor under the Gold price.
Gold price extends pullback from a 10-day Exponential Moving Average (EMA) towards testing the 100-day EMA support, following a failed attempt to cross the two-week-old resistance line.
The downside bias also takes clues from the Moving Average Convergence and Divergence (MACD) indicator’s bearish signals, which in turn suggests the downside break of the immediate 100-day EMA support of $1,820.
However, the Relative Strength Index (RSI) line, placed at 14, is near to the oversold territory and hence suggests the limited room towards the south. As a result, the 61.8% Fibonacci retracement level of the Gold price run-up from late November 2022 to early February 2023, close to $1,812, could challenge the XAU/USD bears.
In a case where the Gold price remains weak past $1,812, the $1,800 threshold and the last December’s low of $1,766 will be in focus.
Alternatively, the aforementioned two-week-old descending trend line and the 10-day EMA< respectively near $1,834 and $1,844, could challenge the XAU/USD rebound.
However, the Gold price recovery remains elusive unless crossing the February 09 swing high surrounding $1,890.
Overall, Gold price remains bearish but the downside room appears limited.
Trend: Further downside expected
Technical Levels: Supports and Resistances
XAUUSD currently trading at 1825.37 at the time of writing. Pair opened at 1834.76 and is trading with a change of -0.51% % .
| Overview | Overview.1 | |
|---|---|---|
| 0 | Today last price | 1825.37 |
| 1 | Today Daily Change | -9.39 |
| 2 | Today Daily Change % | -0.51% |
| 3 | Today daily open | 1834.76 |
The pair is trading below its 20 Daily moving average @ 1881.35, below its 50 Daily moving average @ 1863.68 , above its 100 Daily moving average @ 1789.0 and above its 200 Daily moving average @ 1776.24
| Trends | Trends.1 | |
|---|---|---|
| 0 | Daily SMA20 | 1881.35 |
| 1 | Daily SMA50 | 1863.68 |
| 2 | Daily SMA100 | 1789.00 |
| 3 | Daily SMA200 | 1776.24 |
The previous day high was 1843.9 while the previous day low was 1830.3. The daily 38.2% Fib levels comes at 1835.5, expected to provide resistance. Similarly, the daily 61.8% fib level is at 1838.7, expected to provide resistance.
Note the levels of interest below:
- Pivot support is noted at 1828.74, 1822.72, 1815.14
- Pivot resistance is noted at 1842.34, 1849.92, 1855.94
| Levels | Levels.1 |
|---|---|
| Previous Daily High | 1843.90 |
| Previous Daily Low | 1830.30 |
| Previous Weekly High | 1870.71 |
| Previous Weekly Low | 1818.93 |
| Previous Monthly High | 1949.27 |
| Previous Monthly Low | 1823.76 |
| Daily Fibonacci 38.2% | 1835.50 |
| Daily Fibonacci 61.8% | 1838.70 |
| Daily Pivot Point S1 | 1828.74 |
| Daily Pivot Point S2 | 1822.72 |
| Daily Pivot Point S3 | 1815.14 |
| Daily Pivot Point R1 | 1842.34 |
| Daily Pivot Point R2 | 1849.92 |
| Daily Pivot Point R3 | 1855.94 |
[/s2If]
Join Our Telegram Group
")


