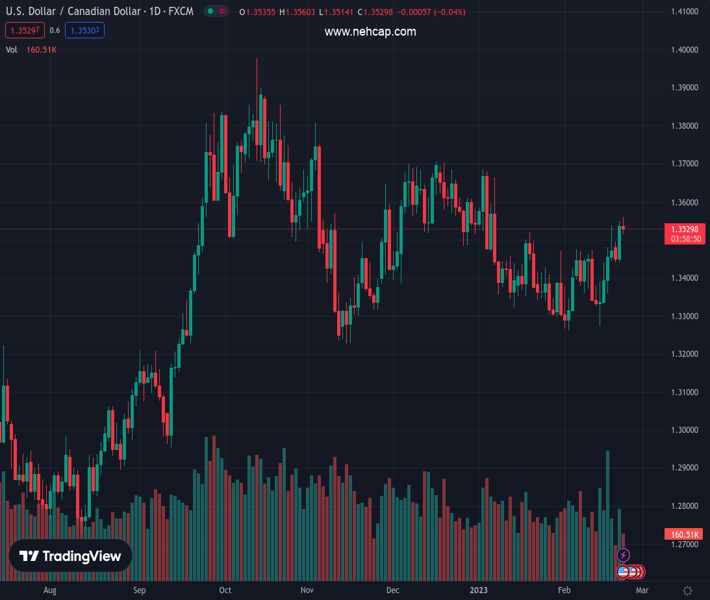
#USDCAD @ 1.35297 collides with solid resistance and retreats to its 1.3520s lows. (Pivot Orderbook analysis)
…
This is a premium post.
[s2If !current_user_can(access_s2member_level4)]Please register for PREMIUM VERSION HERE to read full post below containing analysis. In case of any error or you think you are not able to read the full post below, please email us at support#nehcap.com [lwa][/s2If] [s2If current_user_can(access_s2member_level4)]
- USD/CAD collides with solid resistance and retreats to its 1.3520s lows.
- Traders are bracing for additional forward guidance from the US Federal Reserve.
- If the BoC pauses, the USD/CAD will extend its gains.
The pair currently trades last at 1.35297.
The previous day high was 1.3549 while the previous day low was 1.3441. The daily 38.2% Fib levels comes at 1.3508, expected to provide support. Similarly, the daily 61.8% fib level is at 1.3483, expected to provide support.
The USD/CAD is barely unchanged ahead of the FOMC’s minutes release, though slightly tilted to the downside, with losses of 0.05%. Traders worried that the Fed would raise rates further than expected, dampening the market mood during the last couple of weeks. At the time of typing, the USD/CAD is trading at around 1.3530s.
Wall Street’s bulls are taking a respite before the Fed releases its minutes. US economic data throughout the last two weeks justified the need for further tightening, meaning a higher USD/CAD exchange rate. Inflation data in the US slowed down, except for the monthly readings of the Producer Price Index (PPI), which came above estimates and the prior’s month data. In addition, a Fed regional manufacturing index reported on its survey that prices jumped the most in 10 months, exacerbating a reassessment of how high the Fed will go. Therefore, worried investors turned to safety and bought the US Dollar (USD).
Consequently, the US 10-year Treasury bond yield spiked 40 basis points (bps) and underpinned the greenback.
Aside from this, the Canadian side revealed that inflation cooled down, a sign for the Bank of Canada (BoC) to pause its hiking cycle. Meanwhile, New Home Prices in Canada dived 0.2% in January from December data from Statistics Canada showed on Wednesday, but the annual rate slowed to 2.7%.
Hence, the USD/CAD broke above 1.3500 after trading sideways for almost two months. Nevertheless, the major faced a four-month-old resistance trendline and was rejected after hitting multi-week highs at 1.3560 and dropping toward 1.3520s.
Technical Levels: Supports and Resistances
USDCAD currently trading at 1.3528 at the time of writing. Pair opened at 1.3537 and is trading with a change of -0.07 % .
| Overview | Overview.1 | |
|---|---|---|
| 0 | Today last price | 1.3528 |
| 1 | Today Daily Change | -0.0009 |
| 2 | Today Daily Change % | -0.0700 |
| 3 | Today daily open | 1.3537 |
The pair remains strongly bullish on the daily timeframe. It trades above its 20 SMA @ 1.339, 50 SMA 1.3466, 100 SMA @ 1.3516 and 200 SMA @ 1.3253.
| Trends | Trends.1 | |
|---|---|---|
| 0 | Daily SMA20 | 1.3390 |
| 1 | Daily SMA50 | 1.3466 |
| 2 | Daily SMA100 | 1.3516 |
| 3 | Daily SMA200 | 1.3253 |
The previous day high was 1.3549 while the previous day low was 1.3441. The daily 38.2% Fib levels comes at 1.3508, expected to provide support. Similarly, the daily 61.8% fib level is at 1.3483, expected to provide support.
Note the levels of interest below:
- Pivot support is noted at 1.3469, 1.3401, 1.3361
- Pivot resistance is noted at 1.3577, 1.3617, 1.3685
| Levels | Levels.1 |
|---|---|
| Previous Daily High | 1.3549 |
| Previous Daily Low | 1.3441 |
| Previous Weekly High | 1.3538 |
| Previous Weekly Low | 1.3274 |
| Previous Monthly High | 1.3685 |
| Previous Monthly Low | 1.3300 |
| Daily Fibonacci 38.2% | 1.3508 |
| Daily Fibonacci 61.8% | 1.3483 |
| Daily Pivot Point S1 | 1.3469 |
| Daily Pivot Point S2 | 1.3401 |
| Daily Pivot Point S3 | 1.3361 |
| Daily Pivot Point R1 | 1.3577 |
| Daily Pivot Point R2 | 1.3617 |
| Daily Pivot Point R3 | 1.3685 |
[/s2If]
Join Our Telegram Group
")


