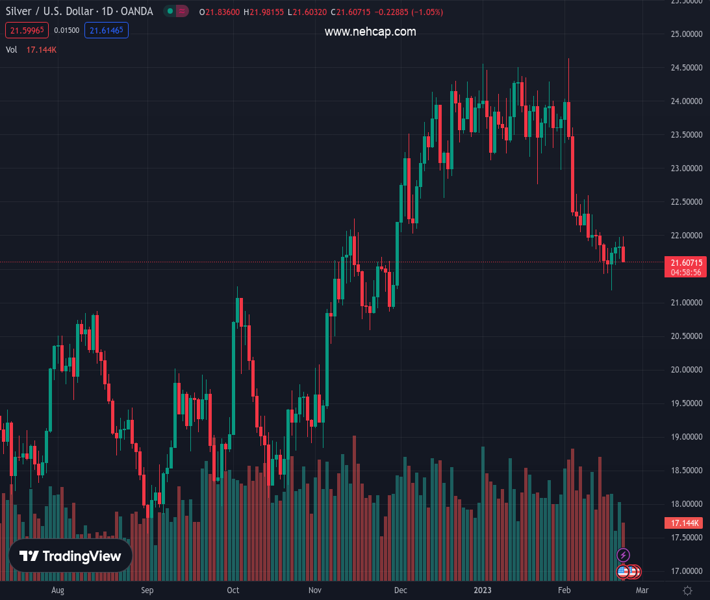
#XAGUSD @ 21.611 Silver price clashed with the 200-day EMA and retreated afterward. (Pivot Orderbook analysis)
…
This is a premium post.
[s2If !current_user_can(access_s2member_level4)]Please register for PREMIUM VERSION HERE to read full post below containing analysis. In case of any error or you think you are not able to read the full post below, please email us at support#nehcap.com [lwa][/s2If] [s2If current_user_can(access_s2member_level4)]
- Silver price clashed with the 200-day EMA and retreated afterward.
- If XAG/USD dives below $21.50, a test of the YTD low at $21.18 is on the cards.
- Oscillators turned bearish, opening the door for Silver’s further downside.
The pair currently trades last at 21.611.
The previous day high was 21.98 while the previous day low was 21.65. The daily 38.2% Fib levels comes at 21.85, expected to provide resistance. Similarly, the daily 61.8% fib level is at 21.77, expected to provide resistance.
Silver price battles at the 200-day Exponential Moving Average (EMA) at $21.93 though it failed to crack the latter and retraced towards Tuesday’s lows as the North American session progressed. Investors awaiting the latest FOMC minutes sought safety in the US Dollar (USD), a headwind for the white metal. At the time of typing, the XAG/USD is trading at $21.62, down 0.70% in the day.
From a daily chart perspective, XAG/USD remains neutral to downward biased, as the white metal stays beneath the important 200-day EMA. Wednesday’s price action remains negative, while the Relative Strength Index (RSI) and the Rate of Change (RoC) indicate that sellers are gathering momentum.
The XAG/USD 4-hour chart portrays the white metal as neutral to downward on an intraday bias. As of typing, Silver has breached the daily pivot point at $21.81, followed by the S1 pivot at $21.66. A bearish continuation is the most probable scenario due to several reasons. The Relative Strength Index (RSI) dived below the 50-mid line, a signal to go short, while the Rate of Change (RoC) is aiming aggressively downwards.
Therefore, the XAG/USD first support would be the S2 pivot point at $21.50. A breach of the latter will expose the S3 daily pivot at $21.35, ahead of the YTD low of $21.18. As an alternate scenario, XAG/USD reclaims the 200-day EMA could pave the way toward $22.00.
Technical Levels: Supports and Resistances
XAGUSD currently trading at 21.64 at the time of writing. Pair opened at 21.84 and is trading with a change of -0.92 % .
| Overview | Overview.1 | |
|---|---|---|
| 0 | Today last price | 21.64 |
| 1 | Today Daily Change | -0.20 |
| 2 | Today Daily Change % | -0.92 |
| 3 | Today daily open | 21.84 |
The pair is trading below its 20 Daily moving average @ 22.59, below its 50 Daily moving average @ 23.27 , below its 100 Daily moving average @ 22.0 and above its 200 Daily moving average @ 21.02
| Trends | Trends.1 | |
|---|---|---|
| 0 | Daily SMA20 | 22.59 |
| 1 | Daily SMA50 | 23.27 |
| 2 | Daily SMA100 | 22.00 |
| 3 | Daily SMA200 | 21.02 |
The previous day high was 21.98 while the previous day low was 21.65. The daily 38.2% Fib levels comes at 21.85, expected to provide resistance. Similarly, the daily 61.8% fib level is at 21.77, expected to provide resistance.
Note the levels of interest below:
- Pivot support is noted at 21.67, 21.49, 21.34
- Pivot resistance is noted at 22.0, 22.15, 22.33
| Levels | Levels.1 |
|---|---|
| Previous Daily High | 21.98 |
| Previous Daily Low | 21.65 |
| Previous Weekly High | 22.08 |
| Previous Weekly Low | 21.18 |
| Previous Monthly High | 24.55 |
| Previous Monthly Low | 22.76 |
| Daily Fibonacci 38.2% | 21.85 |
| Daily Fibonacci 61.8% | 21.77 |
| Daily Pivot Point S1 | 21.67 |
| Daily Pivot Point S2 | 21.49 |
| Daily Pivot Point S3 | 21.34 |
| Daily Pivot Point R1 | 22.00 |
| Daily Pivot Point R2 | 22.15 |
| Daily Pivot Point R3 | 22.33 |
[/s2If]
Join Our Telegram Group
")


