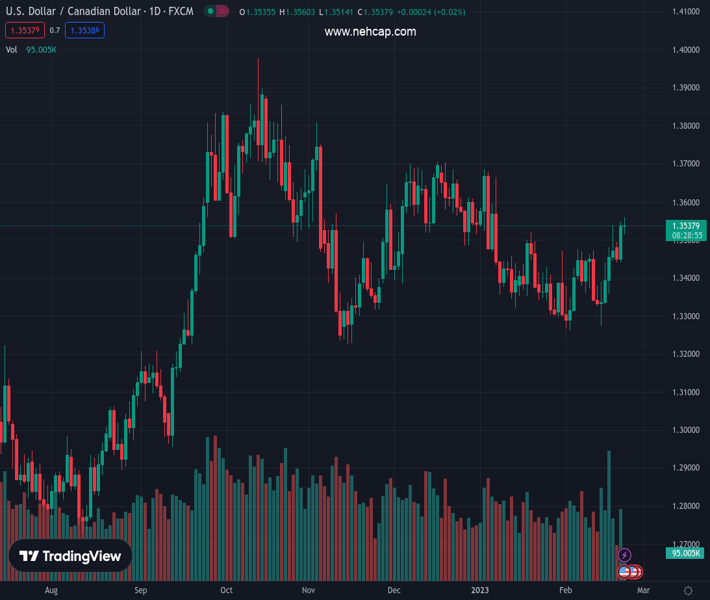
#USDCAD @ 1.35386 pulls back from its highest level since January touched earlier this Wednesday. (Pivot Orderbook analysis)
…
This is a premium post.
[s2If !current_user_can(access_s2member_level4)]Please register for PREMIUM VERSION HERE to read full post below containing analysis. In case of any error or you think you are not able to read the full post below, please email us at support#nehcap.com [lwa][/s2If] [s2If current_user_can(access_s2member_level4)]
- USD/CAD pulls back from its highest level since January touched earlier this Wednesday.
- Sliding Oil prices undermine the Loonie and help limit the downside amid a bullish USD.
- The setup supports prospects for additional gains, though bulls await the FOMC minutes.
The pair currently trades last at 1.35386.
The previous day high was 1.3549 while the previous day low was 1.3441. The daily 38.2% Fib levels comes at 1.3508, expected to provide support. Similarly, the daily 61.8% fib level is at 1.3483, expected to provide support.
The USD/CAD pair retreats from the 1.3560 area, or the highest level since January 6 touched this Wednesday and drops to a fresh daily low in the last hour. Spot prices, however, quickly recover a few pips and hold steady around the 1.3535 region during the early North American session.
The US Dollar remains pinned near a multi-week high amid growing acceptance that the Fed will stick to its hawkish stance. Apart from this, bearish Crude Oil prices undermine the commodity-linked Loonie and act as a tailwind for the USD/CAD pair. Bulls, however, refrain from placing aggressive bets and prefer to move to the sidelines ahead of the FOMC meeting minutes, due for release later during the US session.
From a technical perspective, the overnight strong rally and a daily close above the 100-day Simple Moving Average (SMA) validated the recent bullish breakout through a descending trend channel. Adding to this, oscillators on the daily chart have been gaining positive traction and support prospects for a move towards reclaiming the 1.3600 mark, en route to the YTD peak around the 1.3680-1.3685 area touched in January.
On the flip side, the daily swing low, around the 1.3515 area, coinciding with the 100-day SMA, now seems to protect the immediate downside. Any further decline below the 1.3500 mark might be seen as a buying opportunity and is more likely to remain limited near the 1.3445-1.3440 horizontal zone. The latter should act as a pivotal point, which if broken might prompt technical selling and pave the way for deeper losses.
The USD/CAD pair could then slide towards the 1.3400 round figure. The corrective pullback could get extended further towards the next relevant support near the 1.3330-1.3325 area and the 1.3300 mark. Bears might eventually aim to challenge last week’s swing low, around the 1.3275-1.3270 region.
Technical Levels: Supports and Resistances
USDCAD currently trading at 1.3536 at the time of writing. Pair opened at 1.3537 and is trading with a change of -0.01 % .
| Overview | Overview.1 | |
|---|---|---|
| 0 | Today last price | 1.3536 |
| 1 | Today Daily Change | -0.0001 |
| 2 | Today Daily Change % | -0.0100 |
| 3 | Today daily open | 1.3537 |
The pair remains strongly bullish on the daily timeframe. It trades above its 20 SMA @ 1.339, 50 SMA 1.3466, 100 SMA @ 1.3516 and 200 SMA @ 1.3253.
| Trends | Trends.1 | |
|---|---|---|
| 0 | Daily SMA20 | 1.3390 |
| 1 | Daily SMA50 | 1.3466 |
| 2 | Daily SMA100 | 1.3516 |
| 3 | Daily SMA200 | 1.3253 |
The previous day high was 1.3549 while the previous day low was 1.3441. The daily 38.2% Fib levels comes at 1.3508, expected to provide support. Similarly, the daily 61.8% fib level is at 1.3483, expected to provide support.
Note the levels of interest below:
- Pivot support is noted at 1.3469, 1.3401, 1.3361
- Pivot resistance is noted at 1.3577, 1.3617, 1.3685
| Levels | Levels.1 |
|---|---|
| Previous Daily High | 1.3549 |
| Previous Daily Low | 1.3441 |
| Previous Weekly High | 1.3538 |
| Previous Weekly Low | 1.3274 |
| Previous Monthly High | 1.3685 |
| Previous Monthly Low | 1.3300 |
| Daily Fibonacci 38.2% | 1.3508 |
| Daily Fibonacci 61.8% | 1.3483 |
| Daily Pivot Point S1 | 1.3469 |
| Daily Pivot Point S2 | 1.3401 |
| Daily Pivot Point S3 | 1.3361 |
| Daily Pivot Point R1 | 1.3577 |
| Daily Pivot Point R2 | 1.3617 |
| Daily Pivot Point R3 | 1.3685 |
[/s2If]
Join Our Telegram Group
")


