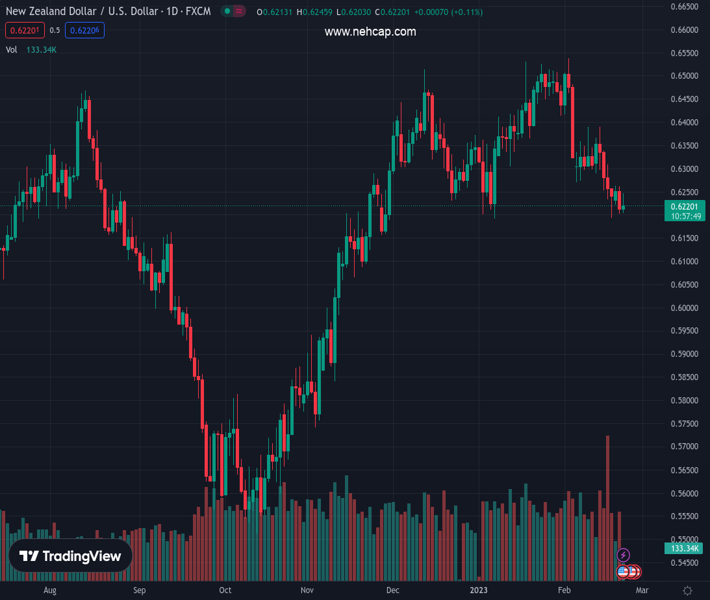
#NZDUSD @ 0.62192 struggles near monthly low despite a hawkish RBNZ rate hike on Wednesday. (Pivot Orderbook analysis)
…
This is a premium post.
[s2If !current_user_can(access_s2member_level4)]Please register for PREMIUM VERSION HERE to read full post below containing analysis. In case of any error or you think you are not able to read the full post below, please email us at support#nehcap.com [lwa][/s2If] [s2If current_user_can(access_s2member_level4)]
- NZD/USD struggles near monthly low despite a hawkish RBNZ rate hike on Wednesday.
- The prospects for further policy tightening by the Fed underpins the USD and caps gains.
- Recession fears also benefit the buck and act as a headwind for the risk-sensitive Kiwi.
- Traders now await the release of the FOMC meeting minutes before placing fresh bets.
The pair currently trades last at 0.62192.
The previous day high was 0.6262 while the previous day low was 0.6203. The daily 38.2% Fib levels comes at 0.6225, expected to provide resistance. Similarly, the daily 61.8% fib level is at 0.6239, expected to provide resistance.
The NZD/USD pair struggles to capitalize on its modest intraday uptick and attracts fresh sellers in the vicinity of mid-0.6200s on Wednesday. The pair is currently placed just a few pips above the 0.6200 mark, or its lowest level since January 6 touched last Friday, and a technically significant 200-day Simple Moving Average (SMA).
The prospect of further policy tightening by the Fed keeps the US Dollar pinned near a multi-week top, which, in turn, is seen as a key factor acting as a headwind for the NZD/USD pair. In fact, the markets seem convinced that the US central bank will stick to its hawkish stance and have been pricing in at least a 25 bps lift-off at the next two FOMC meetings in March and May. The bets were further lifted by strong US PMI prints on Tuesday, which showed that business activity unexpectedly rebounded to an eight-month high in February.
This comes on the back of the upbeat US macro data, which pointed to an economy that remains resilient despite rising borrowing costs. Adding to this, the US CPI and PPI data released last week showed that inflation isn’t coming down quite as fast as hoped. Moreover, several FOMC members, including Fed Chair Jerome Powell, recently stressed the need to keep lifting rates gradually to fully gain control of inflation. This remains supportive of elevated US Treasury bond yields, which, along with a softer risk tone, underpins the safe-haven buck.
The market sentiment remains fragile amid worries about an impending global recession. Apart from this, geopolitical tensions weigh on investors’ sentiment and drive flows away from the risk-sensitive Kiwi. The aforementioned fundamental factors, to a larger extent, overshadow a hawkish rate hike from the Reserve Bank of New Zealand (RBNZ) earlier this Wednesday. This, in turn, suggests that the path of least resistance for the NZD/USD pair is to the downside, though a convincing break below the 200-day SMA is needed to confirm the bearish outlook.
Technical Levels: Supports and Resistances
NZDUSD currently trading at 0.6216 at the time of writing. Pair opened at 0.6209 and is trading with a change of 0.11 % .
| Overview | Overview.1 | |
|---|---|---|
| 0 | Today last price | 0.6216 |
| 1 | Today Daily Change | 0.0007 |
| 2 | Today Daily Change % | 0.1100 |
| 3 | Today daily open | 0.6209 |
The pair is trading below its 20 Daily moving average @ 0.6361, below its 50 Daily moving average @ 0.6359 , above its 100 Daily moving average @ 0.617 and above its 200 Daily moving average @ 0.6186
| Trends | Trends.1 | |
|---|---|---|
| 0 | Daily SMA20 | 0.6361 |
| 1 | Daily SMA50 | 0.6359 |
| 2 | Daily SMA100 | 0.6170 |
| 3 | Daily SMA200 | 0.6186 |
The previous day high was 0.6262 while the previous day low was 0.6203. The daily 38.2% Fib levels comes at 0.6225, expected to provide resistance. Similarly, the daily 61.8% fib level is at 0.6239, expected to provide resistance.
Note the levels of interest below:
- Pivot support is noted at 0.6187, 0.6165, 0.6128
- Pivot resistance is noted at 0.6247, 0.6284, 0.6306
| Levels | Levels.1 |
|---|---|
| Previous Daily High | 0.6262 |
| Previous Daily Low | 0.6203 |
| Previous Weekly High | 0.6391 |
| Previous Weekly Low | 0.6193 |
| Previous Monthly High | 0.6531 |
| Previous Monthly Low | 0.6190 |
| Daily Fibonacci 38.2% | 0.6225 |
| Daily Fibonacci 61.8% | 0.6239 |
| Daily Pivot Point S1 | 0.6187 |
| Daily Pivot Point S2 | 0.6165 |
| Daily Pivot Point S3 | 0.6128 |
| Daily Pivot Point R1 | 0.6247 |
| Daily Pivot Point R2 | 0.6284 |
| Daily Pivot Point R3 | 0.6306 |
[/s2If]
Join Our Telegram Group
")


